Economy

$8 Trillion

Global bond yielding less than zero (yes, that means lenders are paying the Government to let them hold their paper) now exceed 8 Trillion dollars. In total, there are 18 countries with negative bond yields ... in the 10th year of one of the largest global economic expansions no less.

San Ramon CFP  investment advisor 4-15-19.png

Central banks only tool left in their toolbox in an attempt to counter slow or negative growth is to stimulate the economy by lowering interest rates. At some point all that want to borrow have done so and keeping rates so low harm only those who require bond income (retirees). With this going on since the 2008-09 crash and not having the desired effect one has to wonder why continue and then immediately brings to mind this quote

The definition of insanity is doing the same thing over and over again, but expecting different results – Albert Einstein

You need to look no further than the chart above to the reason why I am a firm believer Europe is winning the race …… to the bottom and the next economic crisis will begin from that region of the world.

End of Cycle - On the Horizon?

Late in market cycles brings about peaks in animal spirits. Investors are confident and have long forgotten about the previous major market decline. Caution and discipline are an afterthought as they risk their investment capital in places they normally would not. This is normal human behavior. As an aside, investors do just the opposite right after that major market decline. None of this should be no surprise, it is how we are wired.

The chart below shows the number of companies that went public last year but don’t make money came in at 81%, a new, all-time high. Companies don’t have to make money, look at Amazon how many years they went before making a dime. But those companies are the exception, and like hen’s teeth, very rare. The other thing to note is that the last time it was this high was … wait for it … 1999-2000, the top of the dot com bubble. Remember those times when any company with just a business plan and no earnings went public?  Most of them eventually followed the fate of the dodo, never to be seen again. Remember those times? Oh, the naiveite of investors back then, right? It’s so easy when looking backwards.  

san ramon napfa fiduciary investment advisor CFP - 4-8-19.PNG

 While it’s not 1999 and things are different (they are always different), this time the top culprit was biotech companies. This is not a surprise considering their business model and upfront need for research and product development funding. Second place, were technology companies, another set in the “not a surprise” bucket. Interestingly 'all other companies' came in at a record high. 57% of “the rest” don’t make money. 

Add this to a number of signs that are popping up we are late in this business/market cycle. All cycles eventually end. Unfortunately, we won’t know it has ended until we can see it in the rear view mirror. When you add that this to the fact the current cycle will likely go on for longer than we all expect there is nothing to do for now other than not lose sight of the past.  Oh yah, and have plan

 Those who cannot remember the past are condemned to repeat it - George Santayana (1905)

Flip a Coin

san ramon napfa certified financial planner.png

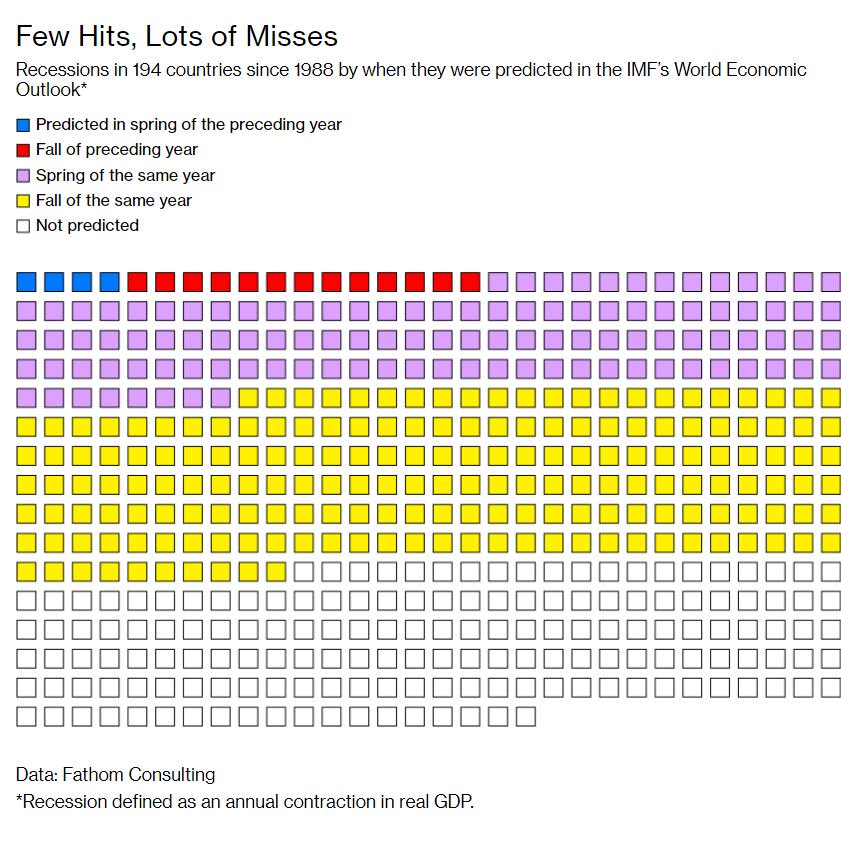
Below is great support for why investors should ignore predictions (especially) and follow only price..

There have been 469 recessions all around the world since 1988. The IMF economists (arguably the best in the world) were only able to see 17 of them coming the year before. Their accuracy, of course, gets better the closer they are to the actual recession. But they completely missed 159 (34%). I don’t need to say it but you are better off flipping a coin than listening to predictions about the future. To read the entire article ….

https://www.bloomberg.com/news/articles/2019-03-28/economists-are-actually-terrible-at-forecasting-recessions …

bay area fee only fiduciary investment advisor CFP.png

Curious Minds Want to Know

There should be no question as to why people need to invest. The cost of everything you need continues to rise and your savings need to keep pace. In the chart of US Price and wage changes below, I wonder if the #2 biggest riser, college tuition, includes the cost of paying bribes, proctor assistance, photoshop training and crew lessons? If not, can you imagine how much further ahead of hospital services it will be in the next update?

Curious minds want to know.

san ramon fee only napfa investment advisor and certified financial planner cfp.gif


Watching the Transports

A bearish engulfing candlestick pattern is a reversal pattern, occurring at the top of an uptrend. The pattern consists of two candlesticks: 1) a smaller bullish candle (Day 1) followed by a 2) larger bearish candle (Day 2). The bullish candle real body of Day 1 is contained within the real body of the bearish candle of Day 2. On day 2, the market gaps up (typically interpreted as a bullish sign) however, the bulls run out of gas and do not push price very far before the bears take over reversing price down, not only filling in the gap from the morning’s open but also below the previous day’s open. A completed pattern warns of a high probability (at least for the short term) the uptrend is over. The larger the candle body and volume on day 2, the higher the probability of a reversal.

san ramon napfa certified financial planning cfp advisor 3-4-19.gif

Taking a look at the weekly chart of the Dow Jones Transportation stocks you can see last week closed with that same bearish engulfing candle. Unfortunately for the bears, while last week’s candle did engulf the prior week, it was not overly large. In addition, the weekly selling volume was just slightly above average, nothing out of the norm. If you look to the immediate left at the most recent prior peak in November of last year, it too formed a bearish engulfing pattern where the gulfing candle was not only huge but was confirmed with excessive selling volume. Notice what happened immediately following. This is why you need to take notice when these patterns appear

san ramon napfa certified financial planning cfp advisor 3-4-19 $TRAN.png

I have been saying for a couple of weeks the market looks tired but was not yet telling us we had reached the end of this reversion to the mean bounce from last Christmas eve. With last week’s close though, the transports have thrown out the yellow caution flag warning long-term investors to likely expect further selling pressure and short-term traders to cash in their chips or at least tighten stops.