Not Another Post on Apple

Can’t you find something different to write about, Chuck?

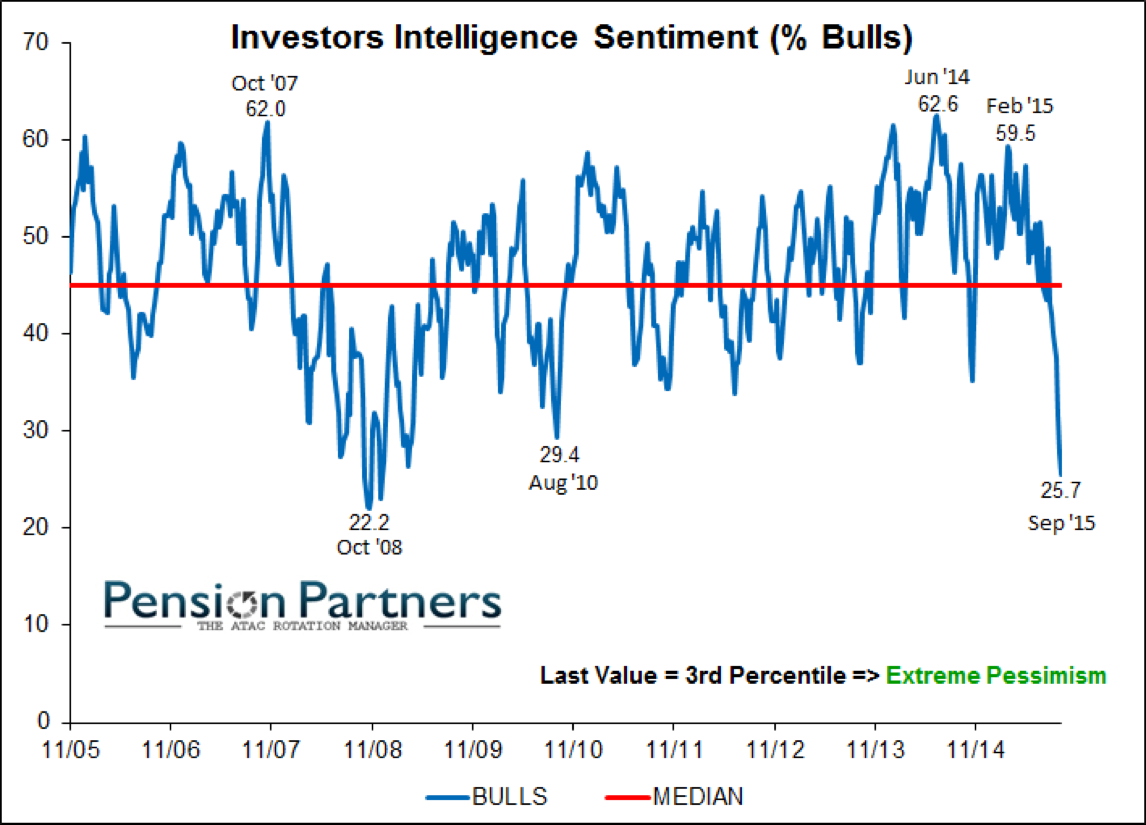
I received an inquiry on what my thoughts were on buying Apple stock right here and I thought I would put them into a blog post because Apple is a great proxy for the broader indexes.  And because the market is at a crossroad however Apple goes, so goes the rest of the market. Or so they say.

I know this post is bad timing being that the FED FOMC is later this morning and most likely whatever they say will drive the markets, potentially trumping what is in the charts. Even if the markets don’t get rattled as I expect, the analysis is still worthwhile as it can be used as a learning tool.

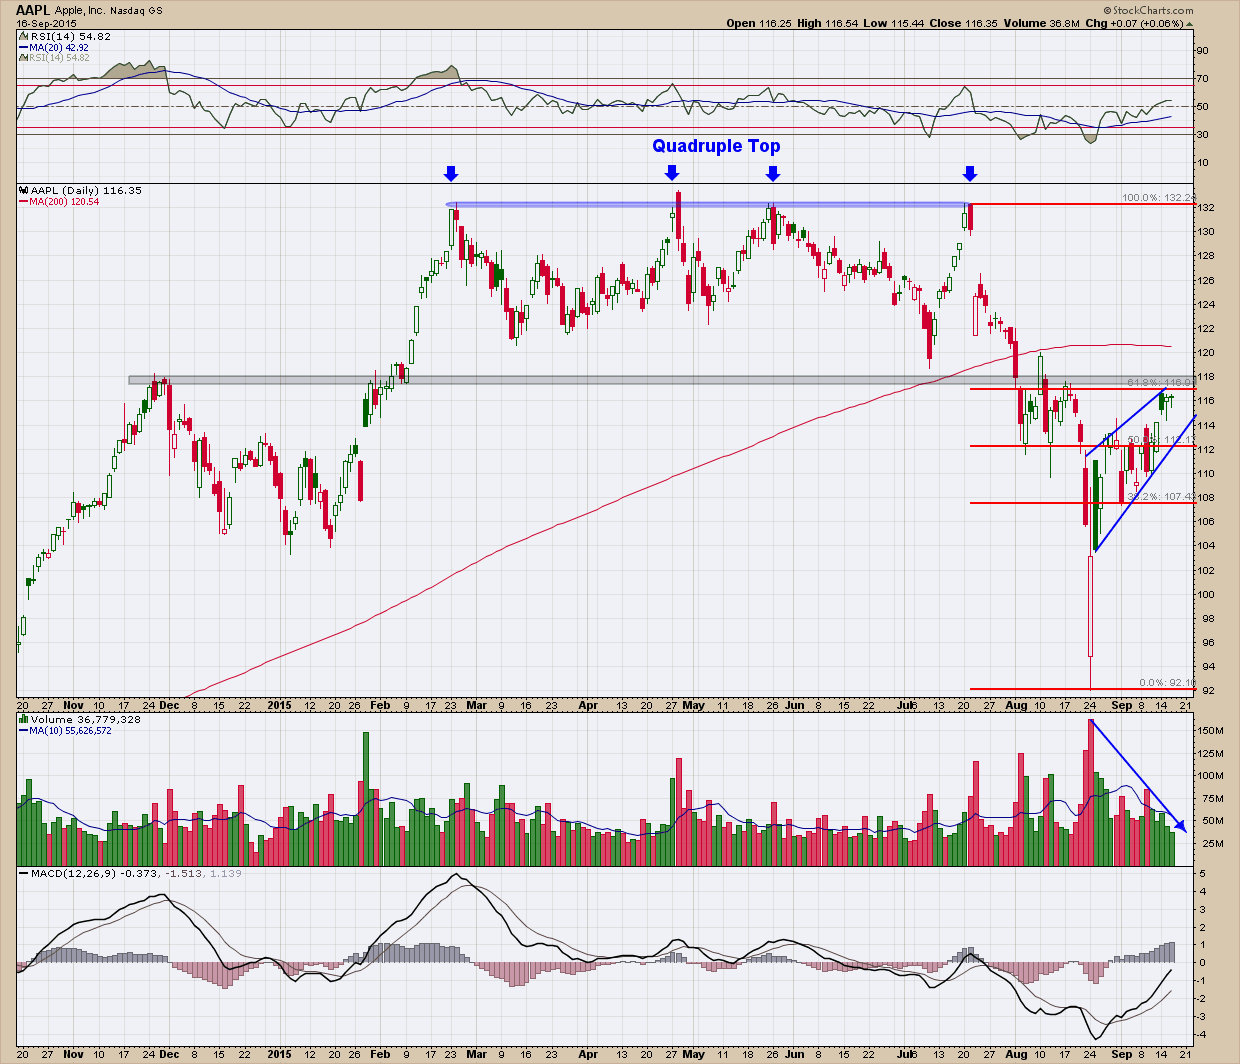
Below is the daily chart of AAPL showing a rare quadruple top (~$132) that formed just before the big sell-off last month where it bottomed at ~$92. You can see we have rallied up to the 61.8% Fib retracement (in red) which coincides almost exactly with the $118 (black) line of resistance. For those unfamiliar with Fibonacci retracements, the 50-61.8% levels are where retracements can peter out and die. The horizontal resistance line represents a ton of potential overhead supply where trapped buyers are looking to get out “even” if given the chance. Additionally a rising wedge (in blue) has formed which are typically bearish setups. RSI momentum in the upper pane while above 50 and pointing higher is constructive, it has changed from ranging in the bullish zone and moved lower and is now within the bearish zone. The MACD in the bottom pane, like RSI is constructive in that it is moving higher, it still sits below zero. As buyers we want to see volume confirm price movement but that has not happened, in fact just the opposite. As you can see, volume has declined significantly on the current retracement higher. Finally and very importantly, not only is price below the 200 day moving average, the 200 dma has now flattened and begun to point down, just the opposite of what you desire to see if you expect price to move higher.

bay area investment adviser wealth manager

When using technical analysis there is no one indicator or type of analysis that provides you a definitive answer, rather it is the weight of ALL the evidence. Right now with the confluence of either neutral or negative evidence, I don’t find AAPL an interesting buy right here. And by correlation, I am just as disinterested in the broader market until, like Apple, it can convert most of the existing “negatives” into positives. And who knows, maybe the FOMC meeting may be the impetus the market needs to turn this around.   …… Or not.  Stay tuned, we will likely know real soon!

In Case There Was Any Doubt …

A new academic study finds that the stock recommendations made by analysts using technical analysis have outperformed those using fundamental analysts.  Over investment horizons ranging from one month to one year, top technicians come out well ahead of leading analysts.

In fact, according to the academic study that reached this conclusion, it’s not even close: While the average buy recommendation from well-known technicians outperforms the broad stock market by 8% over the subsequent nine months, the average stock recommended by leading fundamental analysts underperforms the market.

This groundbreaking study, which just began circulating in academic circles, was conducted by Doron Avramov and Haim Levy, finance professors at the Hebrew University of Jerusalem; and Guy Kaplanksi, a finance professor at Bar-Ilan University. The focus of their study were a thousand pairs of recommendations made between November 2011 and December 2014 on the TV show “Talking Numbers”  as it provides an ideal laboratory for comparing the relative worth of the two investment approaches. The first half of each pair was a recommendation from a top technician about a stock in the news; the second half was a recommendation about that same stock from a leading fundamental analyst.

The researchers measured the performance of each recommendation beginning with its closing price on the day the show first aired. That’s a crucial methodological detail, since that means the researchers are excluding the price impact of the recommendations in the first minutes after the show airs.

bay area investment adviser

Consider first the stocks that the technical analysts identified as strong buys. They on average proceeded to outperform the overall stock market by 7.9% over the subsequent nine months, while the stocks they recommended as strong sells underperformed by 8.9%.

That spread of 16.8 percentage points is highly significant from a statistical point of view. As the professors put it in their study, it means that “technicians display rather impressive stock-picking skills.”

Contrast that with the performance of the fundamental analysts. The researchers found that their strong buys proceeded on average to underperform the market over the nine months following recommendation — though not by enough to conclude at the 95% confidence level that these analysts were actually worse than random. Even worse, the stocks that these analysts rated as strong sells did not perform appreciably differently than those they considered strong buys.

It won’t be easy for fundamental analysts to wriggle out from underneath the weight of these results. Since the TV show creates a head-to-head comparison on the same stocks over similar time horizons, the usual escape valves have been closed off.

Still, when it comes to forecasting the direction of individual stocks over the next several months, this new study definitely shows that top technicians deserve our attention more than leading analysts.

While I am sure this will not be the end of the debate it is nice to see actual proof that technical analysis can provide statistically significantly better returns than random. But even as important, fundamental analysis not only underperforms technical analysis but is no better (and maybe worse) than random selection.

Whither Now?

I have mentioned many times about pattern recognition and its ability to increase your success and investment returns. Below is the daily chart of the SP500 which you can see has formed a symmetrical triangle.  Triangles are one of the few patterns that (when recognized) don’t provide me an edge as I wrote about here. We do know because they are subject to reversals after their initial breakouts, it is best to wait for confirmation before making any investment decision. The other important thing to keep in mind is as price gets closer to the apex, a breakout is imminent and when it does it is usually swift and decisive whichever way it finally moves.

So, once again we are at another crossroad in the market and this one should be resolved very soon. The catalyst likely being our beloved Federal Reserve which meets this week where they are expected to update us on their ongoing financial engineering “experiment” to control the US economy.  This includes a decision on raising interest rates ... or not.

As investors there are times to be active and aggressive and others to be an observer. When triangles are present, I lean towards the latter. Regardless of whichever way we break from this pattern I do believe we still have a destiny with our prior 2014 lows. This will need to occur before we can move on to first break the 2040 overhead resistance and then on to all-time highs. In the mean time when intervention on the scale of what the Fed is capable of doing is always on the table, investors should not try and front-run them but rather patiently wait and then respond based upon the market's reaction to their announcement.

investment advisor bay area

Bully for You

With new death crosses seemingly occurring every day, one indicator the bulls are hoping plays out is sentiment. The Investors Intelligence report this week shows we have reached the lowest bullish reading since Oct 2008.

Bay area investment advisor

As we know sentiment is a contrarian indicator and extreme readings have been good at identifying areas where the likelihood of a market reversal is high. Looking at bullish sentiment is only half the story though. To get the most accurate gauge on sentiment need to look at bearish sentiment too. As you would expect only when both are at extremes does a reversal become a high probability.

bay area financial advisor certified financial advisor cfp

Unfortunately for bulls, as you can see in the chart, bearish sentiment is currently just sitting in neutral and no where close to an extreme.  Until investors become a lot more bearish, it appears sentiment will not be much of a tailwind to higher prices.

Fill in the Blank

Throughout my 15+ year as an investment adviser I am consistently asked about “fill in the blank" with your favorite investing topic dejour.  As always, the person inquiring was watching or listening to a financial news media outlet where they were recommending investors “fill in the blank”. Inevitably when these times arise it takes everything I have not to come unglued (and sadly I must admit I have not been as successful as I wish). I become bothered not because they are asking but because they are being played, a pawn in the game and they don’t see it. Not being the most eloquent of communicators, I struggle with providing a polite response. If I only had a compelling, canned response I could help people see the error in their ways and hopefully save them some money. I recently read an article from Jason Zweig (one of the few financial media who I feel is worth listening to) that provides just that. I wanted to share some of it with you. If you can, print it out and tuck it away in your sock drawer and the next time you have the urge to turn on “fill in the blank”, pull it out and instead go do something more fun and productive such as “fill in the blank” as that will likely provide a more positive impact to your life.

If you want to learn more about Jason you can find it here or read the entire article here.

The emphasis added is mine

=======================================

I was once asked, at a journalism conference, how I defined my job. I said: My job is to write the exact same thing between 50 and 100 times a year in such a way that neither my editors nor my readers will ever think I am repeating myself. That’s because good advice rarely changes, while markets change constantly. The temptation to pander is almost irresistible. And while people need good advice, what they want is advice that sounds good.

The advice that sounds the best in the short run is always the most dangerous in the long run. Everyone wants the secret, the key, the roadmap to the primrose path that leads to El Dorado: the magical low-risk, high-return investment that can double your money in no time. Everyone wants to chase the returns of whatever has been hottest and to shun whatever has gone cold. Most financial journalism, like most of Wall Street itself, is dedicated to a basic principle of marketing: When the ducks quack, feed ‘em.

In practice, for most of the media, that requires telling people to buy Internet stocks in 1999 and early 2000; explaining, in 2005 and 2006, how to “flip” houses; in 2008 and 2009, it meant telling people to dump their stocks and even to buy “leveraged inverse” exchange-traded funds that made explosively risky bets against stocks; and ever since 2008, it has meant touting bonds and the “safety trade” like high-dividend-paying stocks and so-called minimum-volatility stocks.

It’s no wonder that, as brilliant research by the psychologist Paul Andreassen showed many years ago, people who receive frequent news updates on their investments earn lower returns than those who get no news. It’s also no wonder that the media has ignored those findings. Not many people care to admit that they spend their careers being part of the problem instead of trying to be part of the solution.

My job, as I see it, is to learn from other people’s mistakes and from my own. Above all, it means trying to save people from themselves. As the founder of security analysis, Benjamin Graham, wrote in The Intelligent Investor in 1949: “The investor’s chief problem – and even his worst enemy – is likely to be himself.”

One of the main reasons we are all our worst enemies as investors is that the financial universe is set up to deceive us.