Is this 2012, or 2008?

I have so many charts in the queue but one thing I have learned is news trumps the charts every time. With our esteemed Fed Chairwoman speaking Wednesday morning and the world markets on the edge of their collective seats awaiting to hear her every word, I will defer today’s post to the latest from Tom McClellan. He looks at the most recent past election period stock performance, a tale of two totally different outcomes, and extrapolates into which path he thinks we follow next year in his post “Is this 2012, or 2008?”

bay area financial advisor retirement planner

December 11, 2015

We are now less than a year away from the next presidential election, and the stock market’s behavior during election years can be pretty variable.  When a first term president is angling for reelection, he will typically try to spin the news in his favor, declaring victory for anything and everything that is happening.  Investors typically respond well to hearing good news all the time, and the market goes up. 

But when a 2nd term president is in office, investors have the guarantee that the next president will be new and unknown, and that makes them more nervous about investing.  So election years with a 2nd term president are typically more negative than with a 1st term president.

We have seen great examples of this principle during the last 2 presidential election years.  And that is the point for this week.  The SP500 price action for the past 3 years has looked a lot like the 2008-2011 period.  It has also looked like the 2004-07 period.  And now we are at the point where those two patterns diverge from each other, and the outcome for each was a whole lot different.  So it is important right now to figure which schedule the market is still on. 

Robert Frost once wrote about the two roads that diverged in a wood, and how taking the road less traveled made all the difference.  We might wish that we all had not traveled the road of 2008, but that is the more likely path for the stock market in 2016, given that it is a 2nd term election year. 

Zooming in closer, we can see that the plots of both prior patterns look very similar right up to the point where we are right now.  But going forward into 2016, they show entirely different patterns.

bay area certified financial planner retirement and investment management expert

So the market is at a decision point over which path it is going to follow going forward from here.  It has arguably been following both patterns up until now, but it cannot follow both patterns in 2016. 

As I survey the overall situation, I am persuaded that the market in 2016 will follow the more bearish path.  Here are the main reasons:

1. 2016 is a second term election year, and so investors will have to grapple with the certainty of an unknown new president.

2. We have already seen a RASI +500 failure for both the A-D and Volume RASIs, indicating that liquidity is weak.

3. The eurodollar COT leading indication calls for a down move into April 2016, and it does not show a final bottom until October 2016.

4. US federal tax receipts have already gone above the 18% threshold, which promises a recession.

5. The spread between German 10-year “bunds” and 10-year T-Notes has already turned down from a high level. 

6. High-yield corporate bonds have been extremely weak, which usually leads to illiquidity that bites the stock market.

Got Junk in Your Trunk?

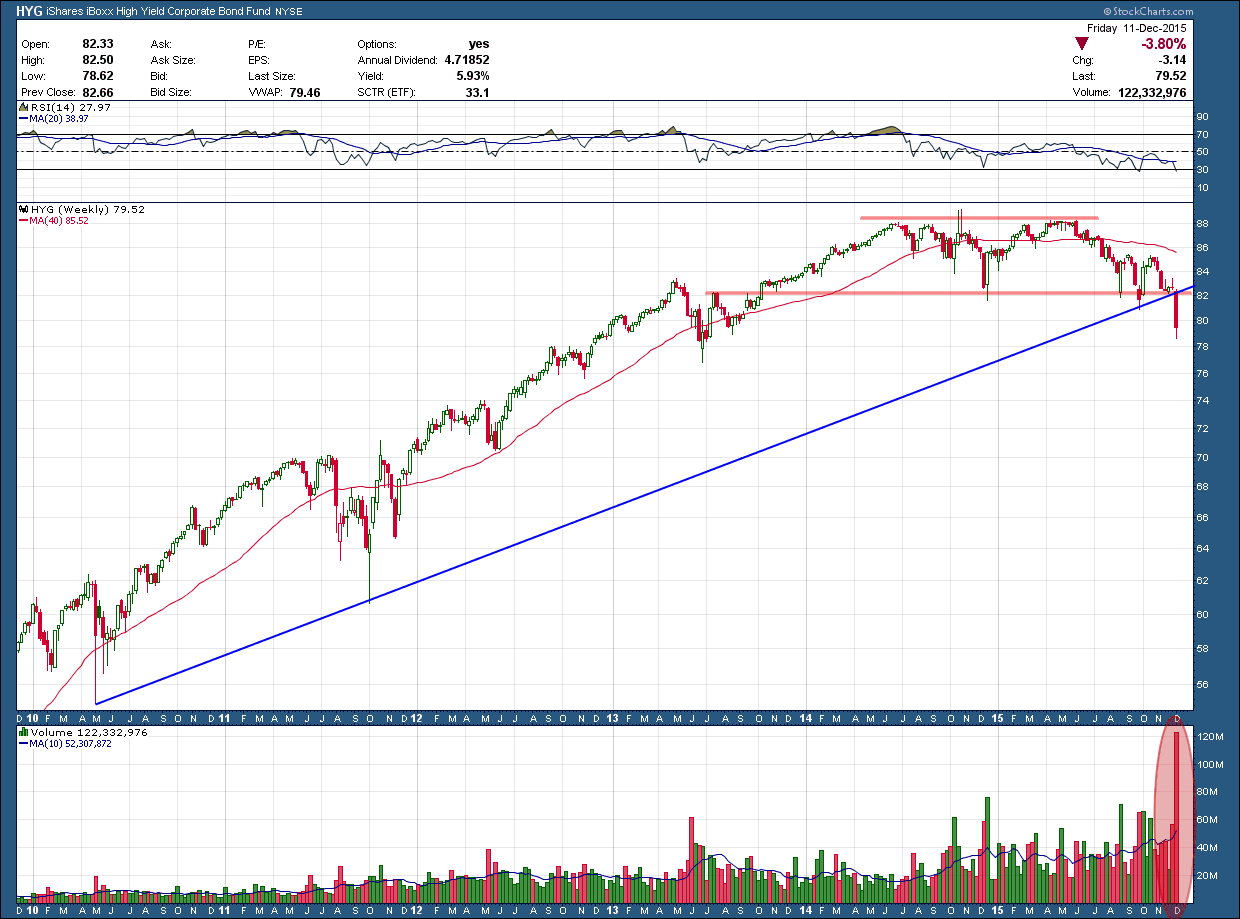
On last month’ video, I mentioned one of my biggest concerns after looking over the charts was the junk bond market. The concern was we were consolidating and once again testing the lower boundaries of the range.  A break below could not only push prices much lower but ultimately pull stocks along with them. The concern is the further oil falls and the longer the price stays depressed the greater the likelihood those companies who borrowed heavily to capitalize on the US energy boom will NOT be able to pay back their loans.  What happens then? The banks that lent the money will be on the hook. And, depending upon their leverage and exposure, could be setting up for another 2008-type crisis (that too was debt related, the difference was then it was housing debt).  We are not talking chump change as it is estimated there is 400 hundred billion of energy related junk bonds and half is now “distressed”

This past week stock market participants watched as crude continued its cascade lower pushing energy stocks even further and junk bonds joined the party with gusto. One junk bond etf I follow, HYG, broke down hard below both its rising (blue) and horizontal (red) support as I feared would eventually happen. Notice also how price is firmly below the red 200 day moving average which has now curled over and is pointing down. Volume was enormous, more than 3x times its long term average and the greatest in the history of this ETF.   

bay area financial advisor, wealth manager and retirement planner

Large volume is what you want to see to confirm once price has made a move of technical significance which in HYG’s case was its break of support. This setup is indicating we will likely see much lower prices ahead. While this is a very high probability setup, I have to admit there is one element that has me somewhat cautious. A major selloff accompanied by extra ordinary high volume can be a capitulatory bottom. Meaning, if the volume was so high there are no sellers left and there is only one direction it can go …. Up.  Of course the only way we will know is at some point in the future and we can look back and say to ourselves, “What a great buying opportunity that was”

Investors love junk in a bull markets as they not only get better than average income but also can participate in stock like appreciation. Unfortunately, what goes up can come down just as far. Regardless of the chance this is a capitulatory bottom, I see no reason, to own junk bonds in an aged bull market.

Price is All That Matters

In the early years of my technical analysis training every night one of my mentors would say either, “only price pays” or “price is all that matters”.  Hearing that same thing over and over again used to frustrate me to no end. Whaddya mean only prices pays? What about earnings?  What about the FED? What about the Greece default?  What about, what about, what about? Those things matter darn it!  After finding the nerve I asked what it meant. He said it meant that as an investor the only thing I should pay attention to is price because everything else was noise. While that sort of helped it still was not complexly clear. Not until many months later did it finally click. I saw this comment on stocktwits.com yesterday and after a good belly laugh I immediately flashed back to the “price is all that matters” discussion of years past. I wished I had this then as it may have “clicked” a little sooner. 

Hopefully, if it hasn’t quite clicked yet for you, it may help you. If not, a good laugh is almost as important. Keep in mind it is about interest rates when in fact it could be about any other topic OTHER THAN PRICE.  

bay area financial advisor investment maangement retirement planning expert

The bottom line is everything, other than price, can be used to support a bullish or bearish argument depending upon which side of the fence you are on. Everything whether it is earnings, the FED, Greece (and maybe even Donald Trump) is reflected into price. Since price is all the information that exists in the market why not simplify life, ignore the noise and focus only on it because it is the only thing that matters.

Diamonds Aren’t an Investors Best Friend

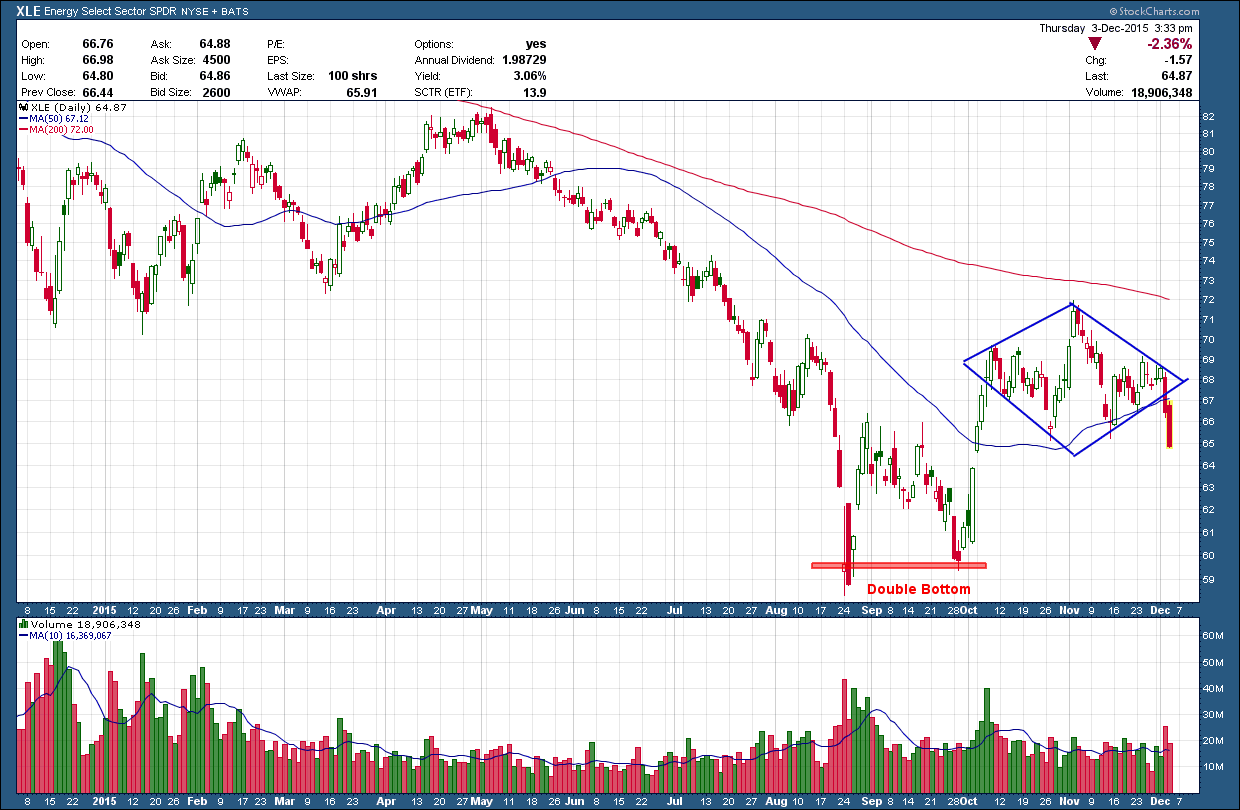
Diamonds are a relatively rare pattern so I wanted to take a look at one that has recently developed on XLE. The diamond pattern is made up from two back-to-back symmetrical triangles and warn of a potential reversal ahead.  Like their triangle makeup, they are often subject to reversals after a breakout so their management can be challenging.  As you can see in the energy sector ETF, XLE, its price followed the path of lower oil prices, losing 30% from its peak in May of last year creating a double bottom. From there you can see price climbed higher and then began to consolidate which has allowed it the time to develop the diamond.

expert bay area investment advisor certified finanical planner

Price broke decisively lower Wednesday and confirmed the move with larger than normal volume. The follow through on Thursday provided additional needed to tell us this is likely not a whipsaw/fake-out and to expect lower prices ahead. The pattern target is back down at the prior double bottom lows around 59 1/2.  I would expect short sellers to jump on board and add more strength to the downside so I would not be surprised by an overshoot of the target.

There should be no surprise to expect lower prices as not only are we below the (red) 200 day moving average but it has a negative slope which is a huge red warning flag any long investor is fighting the trend.

Remember safety first. Don’t fight the Fed. Don’t fight the trend and don’t eat week old sushi!