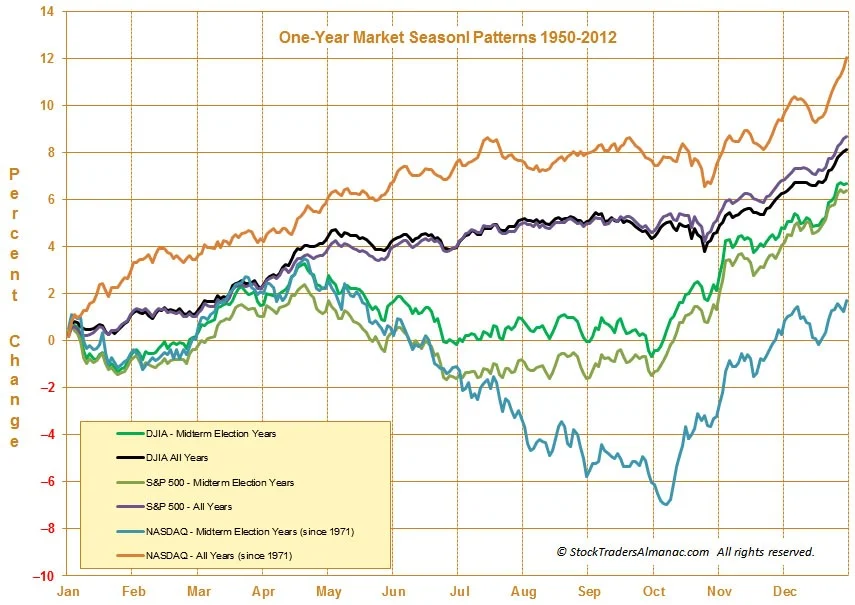
In spite of recent end of quarter (q3) volatility and ~10% correction, I have been telling investors to expect a good ending to the year for US stocks (and likely early part of next year too). Its not that I can see into the future, rather there is a 2-pattern seasonality alignment which provides investors a high probability bullish outcome for US stocks over the next quarter or so. The first pattern is the traditional year-end (“Santa Claus”) rally that customarily begins sometime in October of each year. This is caused from sentiment changes the joys of the holiday season brings and optimism that typically abounds as the year winds down and a new one is christened. The chart below is a historical look at performance on the 3 major US stock indexes by month during the period of 1950-2012 and clearly reflects these year-end rallies.
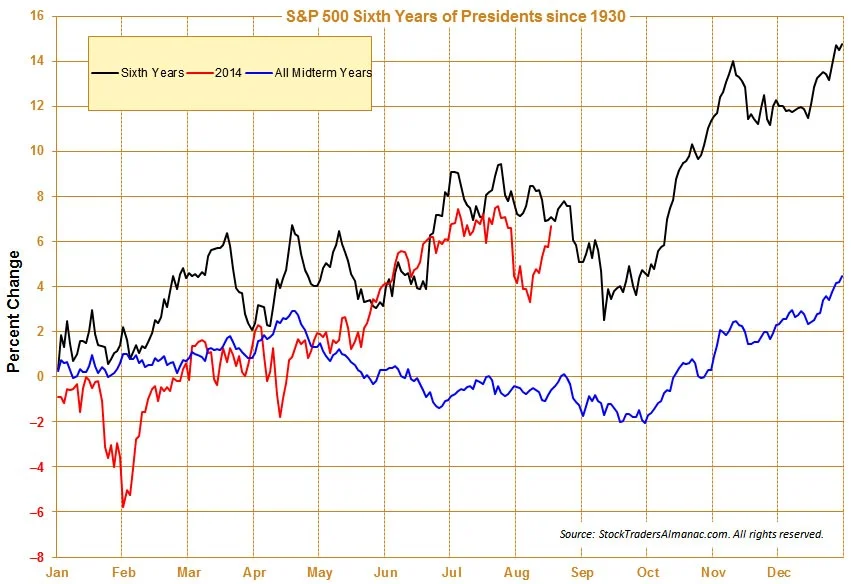
The second pattern is that the sixth year of 2-term presidents have traditionally been very good for stock market returns, but typically don’t manifest until the 4th quarter. The chart below which represents the SP500 US stock index returns by month since 1950 unmistakably reflects the historical out-performance during this time.
Two patterns aligning up at the same time (the 4th quarter of this year) provides a potential huge edge for investors (successful investing is all about investing at times when the odds/probabilities are in your favor). This edge combined with the fact that stocks just recently endured an ~10% have gone on to put it in the rear view mirror in very short order, should be the impetus for investors to stay the course and for those who may have reduced their risk, to consider adding some. There are of course no guarantees and only time will tell if this year-end will turn out to be as bullish as I expect but until proven otherwise I am looking to take advantage to what appears to be a short-term very favorable investing environment.
Charts courtesy of Stocktradersalmanac.com