The Nasdaq 100 index, QQQ, is made up of the top 100 largest non-financial stocks traded on the Nasdaq exchange. While has companies across all sectors, the bulk of its components are definitely skewed towards technology in all forms. For this reason, this index usually outperforms the broader market during bull runs and is the biggest loser when the bears come out of hibernation.
Below is an 18-year lookback on the index with RSI momentum in the upper pane, price in the middle and volume at the bottom. It should be no surprise price has stalled at this current level as we are running up against major overhead resistance. You can see the index has so far attempted to move through it 3x (red arrows) and was rejected each time. Additionally this overhead resistance was met at the same time we have formed bearish negative divergence. This is where momentum (upper pane) is falling and price (middle pane) is rising. While it’s not a slam dunk negative divergence always turns problematic, when appearing on a weekly chart like this it is, at minimum, a yellow warning flag that things aren’t right. At worst it can be the sign of an impending reversal. You can see over the past 18 years this signal has only appeared twice. The first time at the 2000 top it appeared at the beginning of its multi-year > 80% loss. While not as dramatic, it raised its ugly head again in 2012 which signaled the start of a rather mundane (in comparison) 13% speed bump.

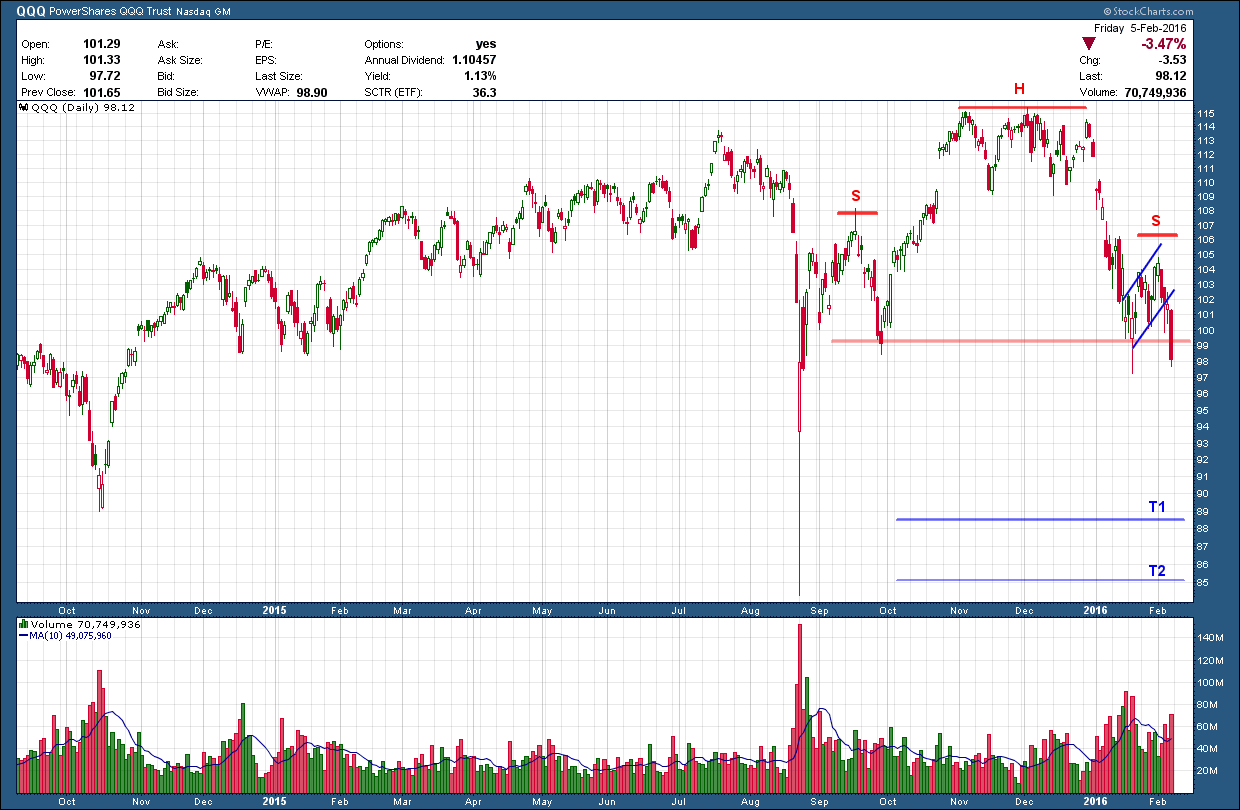
Zooming in to take a closer look at just the past year, the daily chart below indicates a couple of very ugly patterns have not only developed but have possibly just gotten under way. Firstly, as with most tops, some sort of pattern forms and becomes clearer in its latter stages and this time is no different as a very symmetrical head and shoulders (H&S) pattern has developed. For this pattern to complete, price must fall (and hold) below its (red horizontal) neckline. This occurred last Friday. If confirmed next week, it warns of further weakness with the “T2” level near last August’s impulse low being a potential target. Not always but many times the right should portion of a H&S patterns will develop its own smaller bearish pattern. When this occurs it helps to strengthen the validity of the bigger pattern. Looking closely you can see the right shoulder formed the flag (highlighted in blue) of a bear flag. The pole of the flag is reflected by the preceding rapid decline from ~114 to ~99. If you remember your patterns, flags are validated by price breaking below its lower support, which is exactly what happened with Friday’s big red candle. The measured move for the right shoulder’s bear flag I have marked and labeled as T1. This works out to be just a tad less than 10% below Friday’s close.
The broader markets have been in trouble for months but the Nasdaq 100 has been one of the last bastions of strength and hope as it has done a great job limiting the broader market losses to a little more than 10%. If this index doesn’t find some footing quickly next week and continues its move down, it could be the catalyst for a much deeper flush, something I have been concerned with and been warning about for months. Unless you are very nimble or a short seller, this market is looking for trouble.