Topping patterns are set, all that is needed now is confirmation for the bears to be loose.
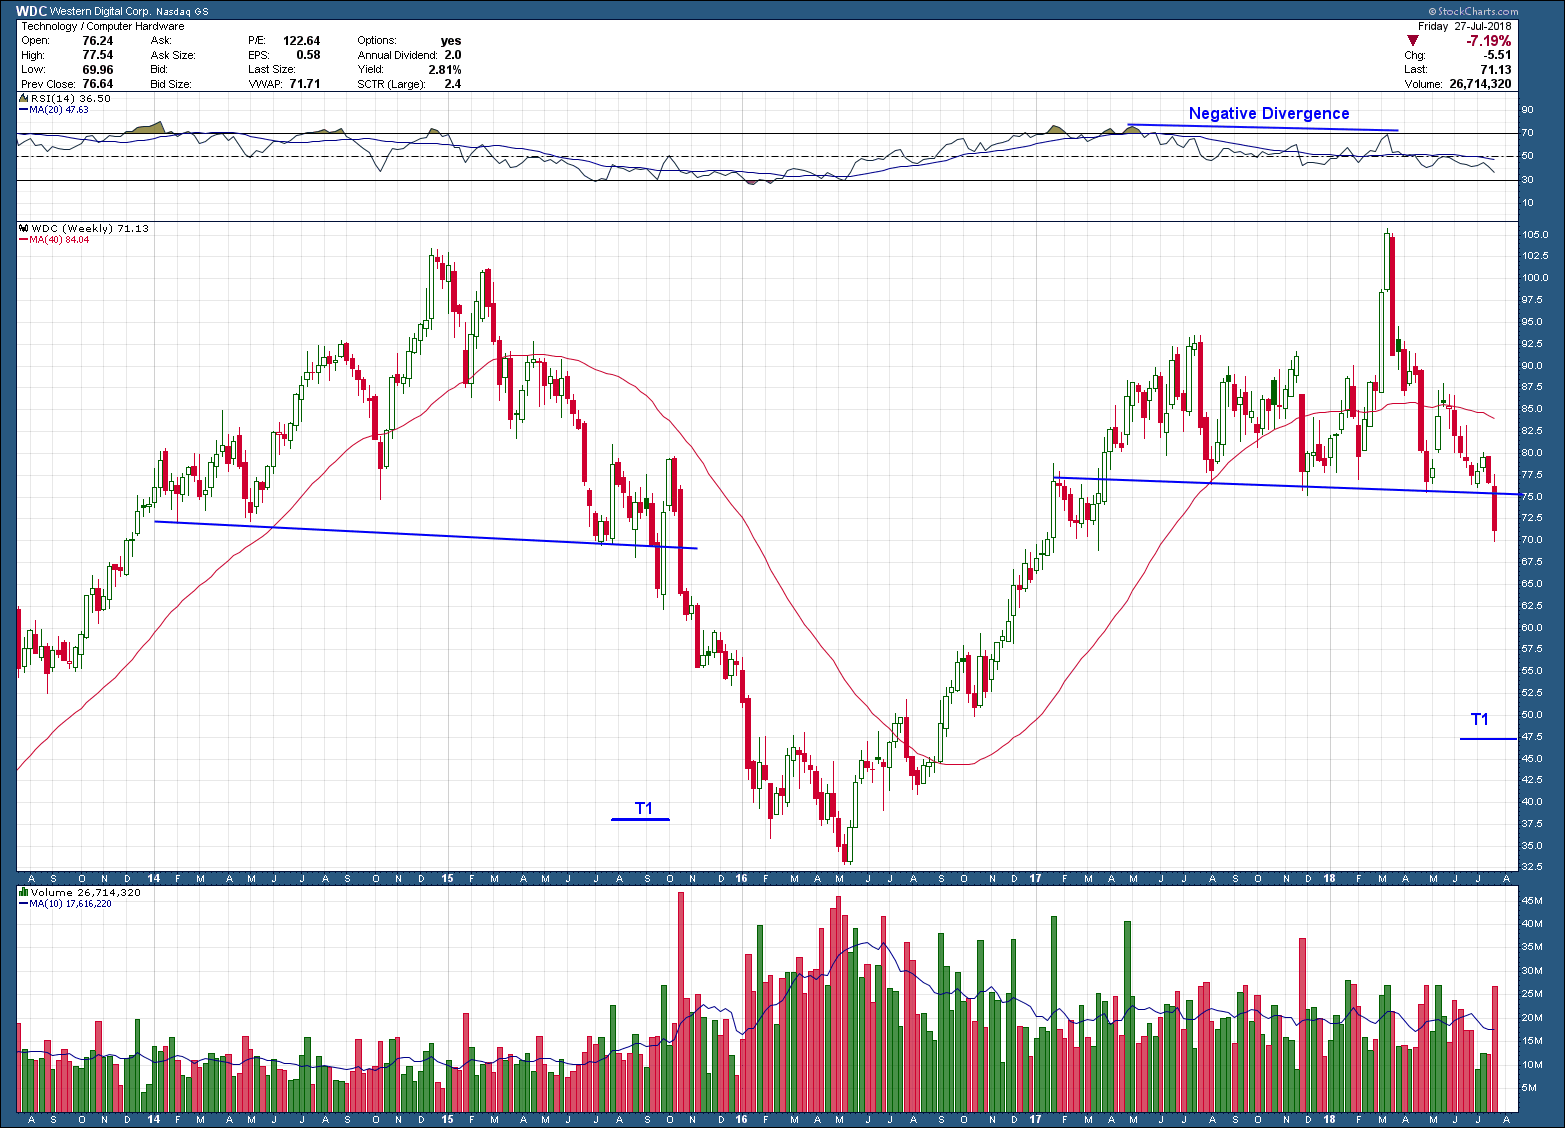
The first chart of WDC I meant to post 2 weeks ago before it had broken below the neckline of the head and shoulders pattern which occurred last week. If this pattern confirms and follows through, the likely target is down at T1, a 30%+ decline from last week’s close. Before I move on I want to point out if you look to the left-hand side of the chart you can see this is not the first time WDC has formed this pattern. The last time, back in 2015 the stock, broke the neckline, confirmed the pattern and exceeded its target as it fell 68% (peak to trough) before forming a bottom with positive divergence. Will history repeat? IF so, this looks like an ideal setup for a short.
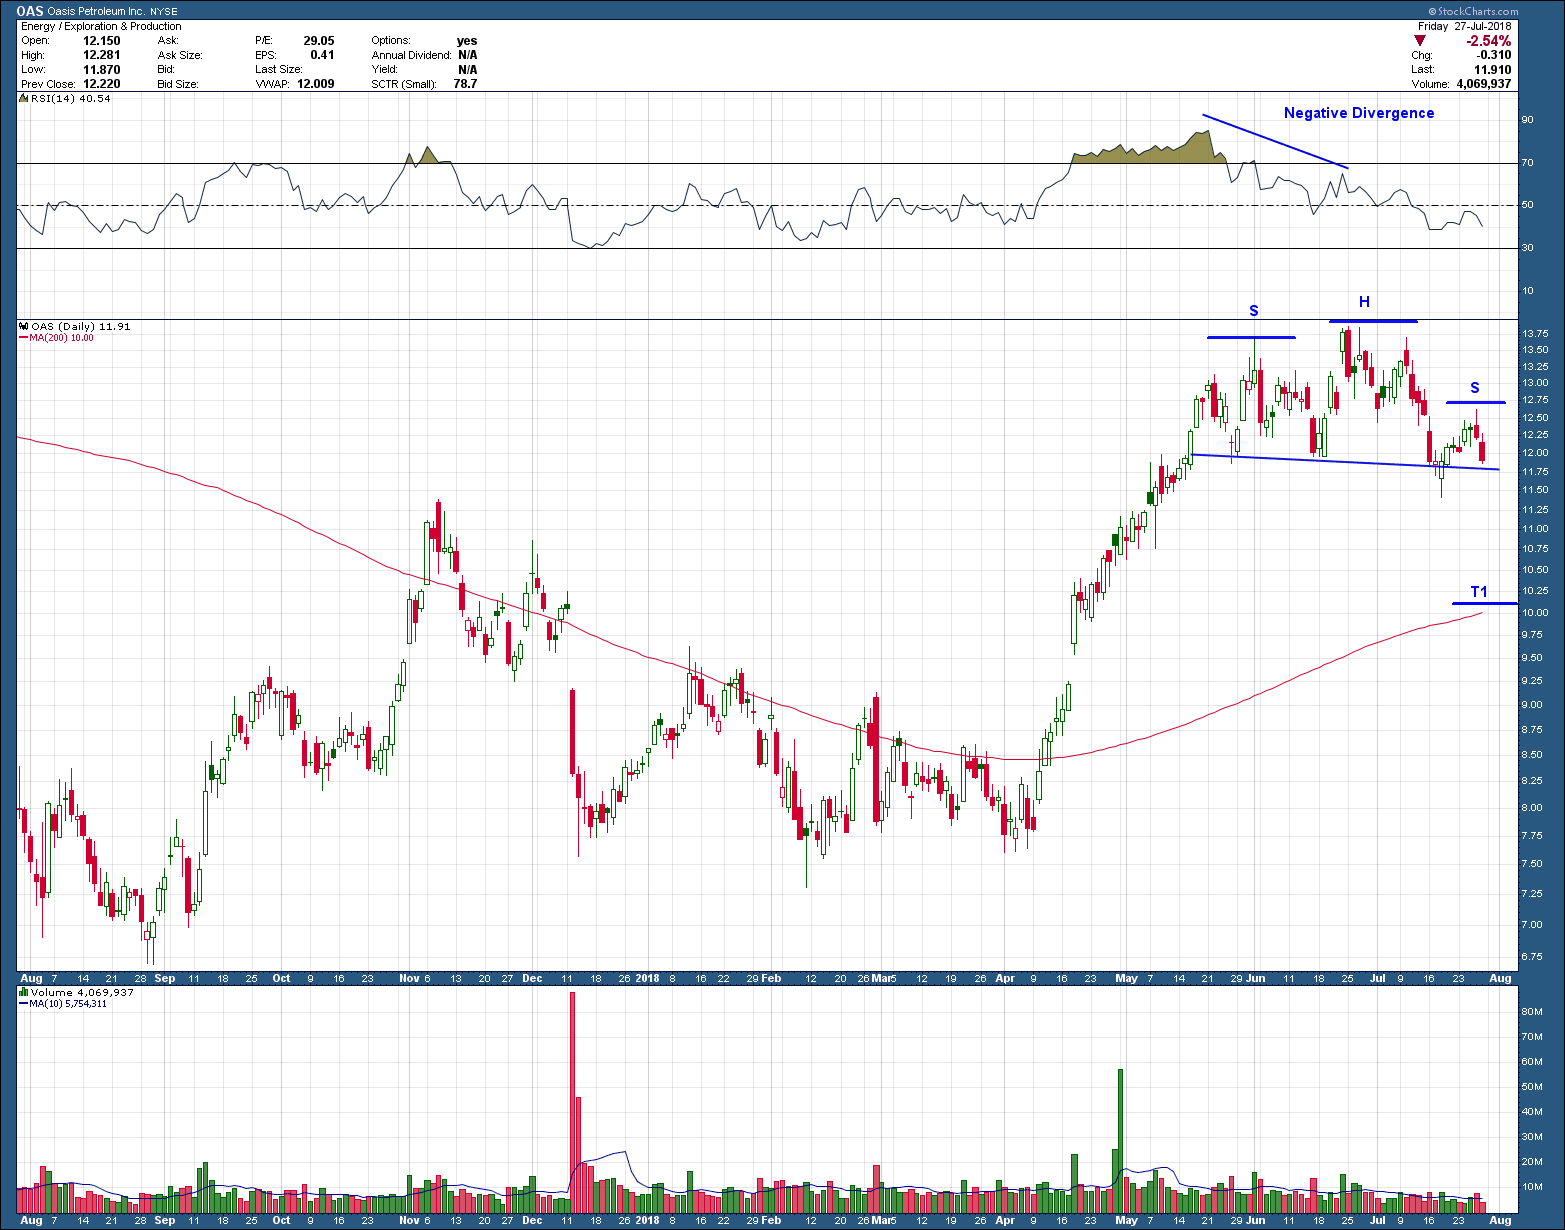
The next chart of OAS looks to be where WDC was a couple of weeks ago. It too, has formed a topping pattern but has yet to break below its neckline or confirm the pattern. If it does, the target is down at T1, some 15% below last weeks decline and just above the 200dma. If the market wants to move lower here in the short term, the open gap below T1 is screaming to be filled and where OAS would find major support if T1 did not hold.
Overall, I am seeing a lot of topping patterns, weakness in stocks that were leaders and bullish patterns that fail. This, combined with troubling action in small caps and at a time when stocks are typically seasonally weak, I am looking to take some risk off the table if the sentiment from earnings announcements continues to disappoint.