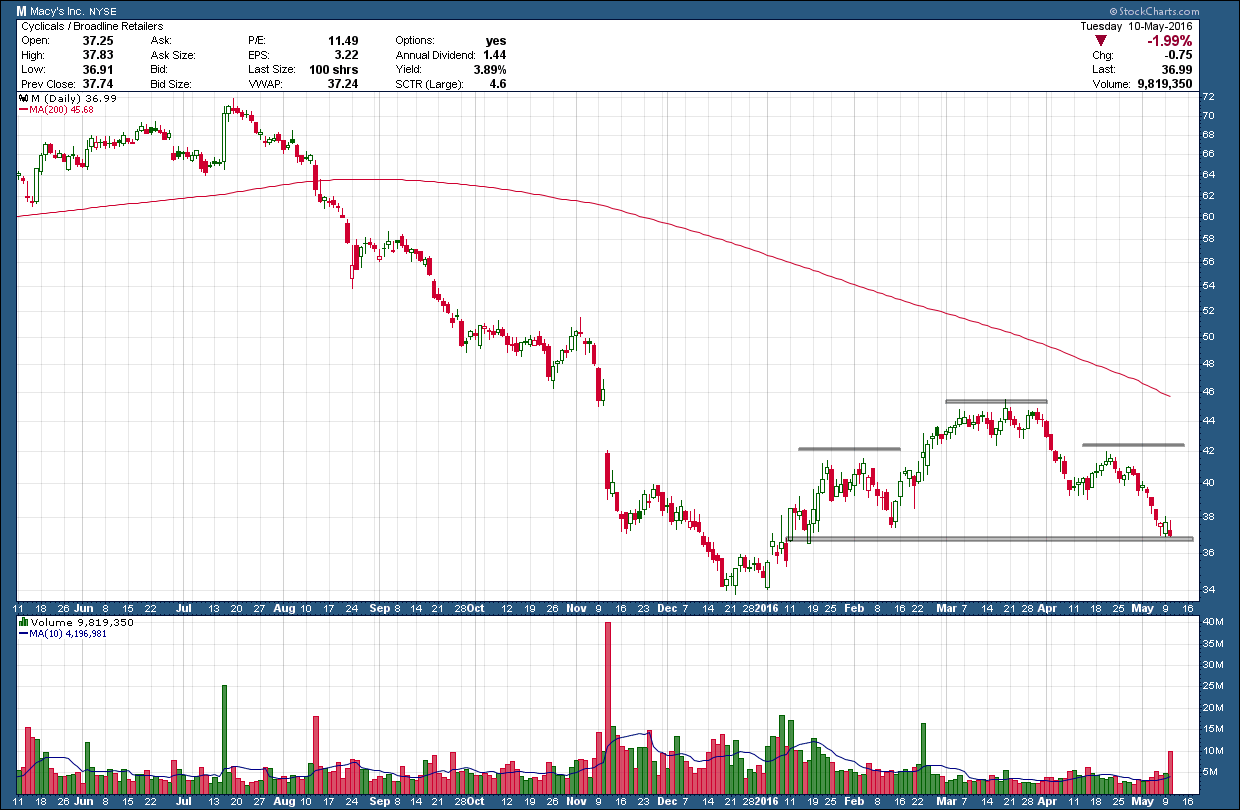
I have been watching in awe the unwinding of Macy’s (M) stock for the past 9 months as it peaked at almost $72/share last July. I am so disappointed I missed the huge profit opportunity it created on the short side. Since that time you can see in the weekly chart below its share price has been more than cut in half bottoming just under $34 in December. Since then it has formed a huge topping pattern that, if you squint real hard, looks kind of like a deformed head and shoulders (H&S) pattern. A thing of beauty and symmetry, it is not. In addition, if it were a true H&S pattern its projected target is zero. Macy's would be going out of business. Not likely! For this reason I ignore the pattern but can’t ignore the rest of the chart. With a strongly downward pointing 200 day moving average and RSI momentum in the bearish zone and falling, combined with lower highs and lower lows hints of more downside for the stock.

Quite frequently when looking at weekly charts you will see smaller, shorter term patterns form within the much larger pattern and Macy’s is no different. Zooming in more closely at the right shoulder of the H&S pattern on the chart above we can see a smaller, more symmetrical and better formed H&S pattern that is sitting on important support as shown below. This pattern has a much more reasonable downside target in the $27 area if it were to trigger and complete.
With Macy’s (M) reporting earnings tomorrow I wanted to get this post out ahead as it could be the catalyst to start its next leg down. While I don’t give it a high probability and because news trumps the charts, if they blow away the number that December low could turn out to be “the” bottom and marks the start of a new uptrend. Either way, this is going to be fun to watch!