On December 4th I wrote about XLE, the energy ETF breaking out to the downside from the diamond reversal pattern which pointed to lower prices ahead. I stated “the pattern target is back down at the prior double bottom lows around 59 1/2. I would expect short sellers to jump on board and add more strength to the downside so I would not be surprised by an overshoot of the target.”
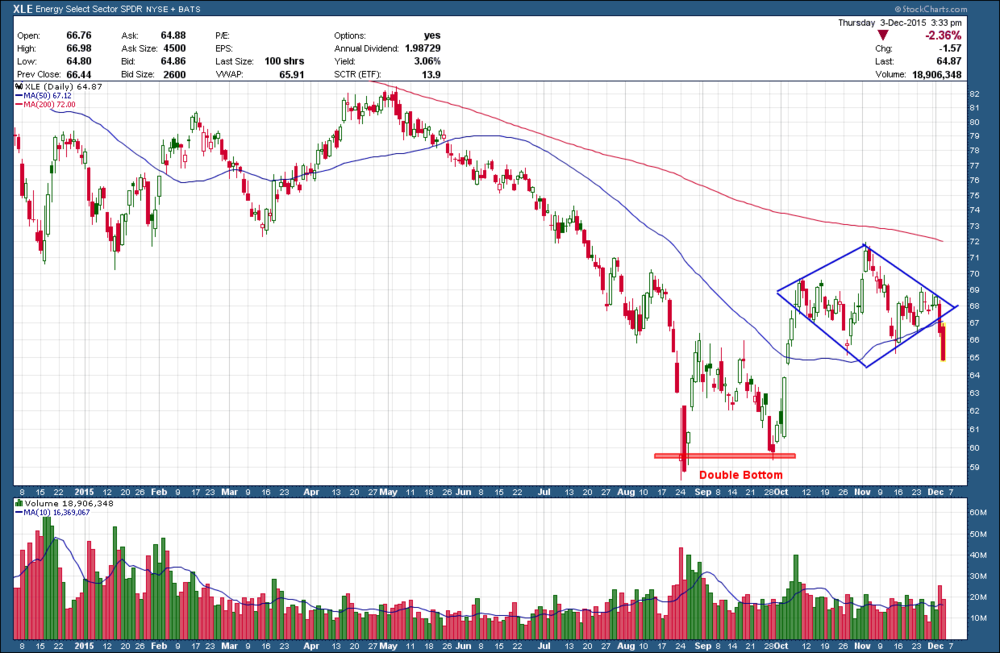
Revisiting an updated XLE chart below we can see that price bottomed at $58.85 nicely within the targeted area. Once it hit this level it found support (as expected) and began consolidating. Interestingly, during this consolidation it formed another diamond. Not quite as symmetrical and pretty as the first, but a diamond nonetheless. This is the first time I have seen consecutive diamonds so I am not sure what additional significance if any it provides but I thought I should mention it. As you know, diamonds are usually reversal patterns but investors are best to wait for confirmation to see which direction price actually moves once out of the pattern before they put money to work (they are just back to back triangles which we don’t trust) . In this case, it appears as if it is not a reversal but rather a continuation as price broke, once again, to the downside. The target for this pattern is the width of the diamond subtracted to from its breakout price which, as it turns out, is at today’s lows.

Anyone who followed my recommendation is up as much as 22% depending upon their entry and should consider booking profits. I prefer to present blog ideas as they happen rather than after the fact. Unfortunately, this started to unfold as the overall market begin to unravel. In either case it can be used as a good learning tool for how to manage and invest in diamond patterns.