Stocks

The Wider the Base …

The Dow Jones Transportation index apparently was not invited to the all-time high stock party and as has been both lagging and dragging on the overall market. Stock market bulls would like to see some of the lagging sectors begin to participate and catch up to technology which has been doing most of the heavy lifting pushing the market higher. A good place to start would be the transports and it looks as if the airline stocks may be setting up to cooperate and pull the transports higher.

As you can see in the chart below, the airline index, $XAL, rallied strongly, peaked last December and has been in a tight consolidation for the last six months, forming a bullish cup and handle continuation pattern. This consolidation has allowed the December overbought high to unwind. Notice also how far price got extended beyond the red 200 day moving average in December, another indication it needed a breather. 

San Ramon fee only retirement CFP & independent financial advisor - 6-7-17 - xal

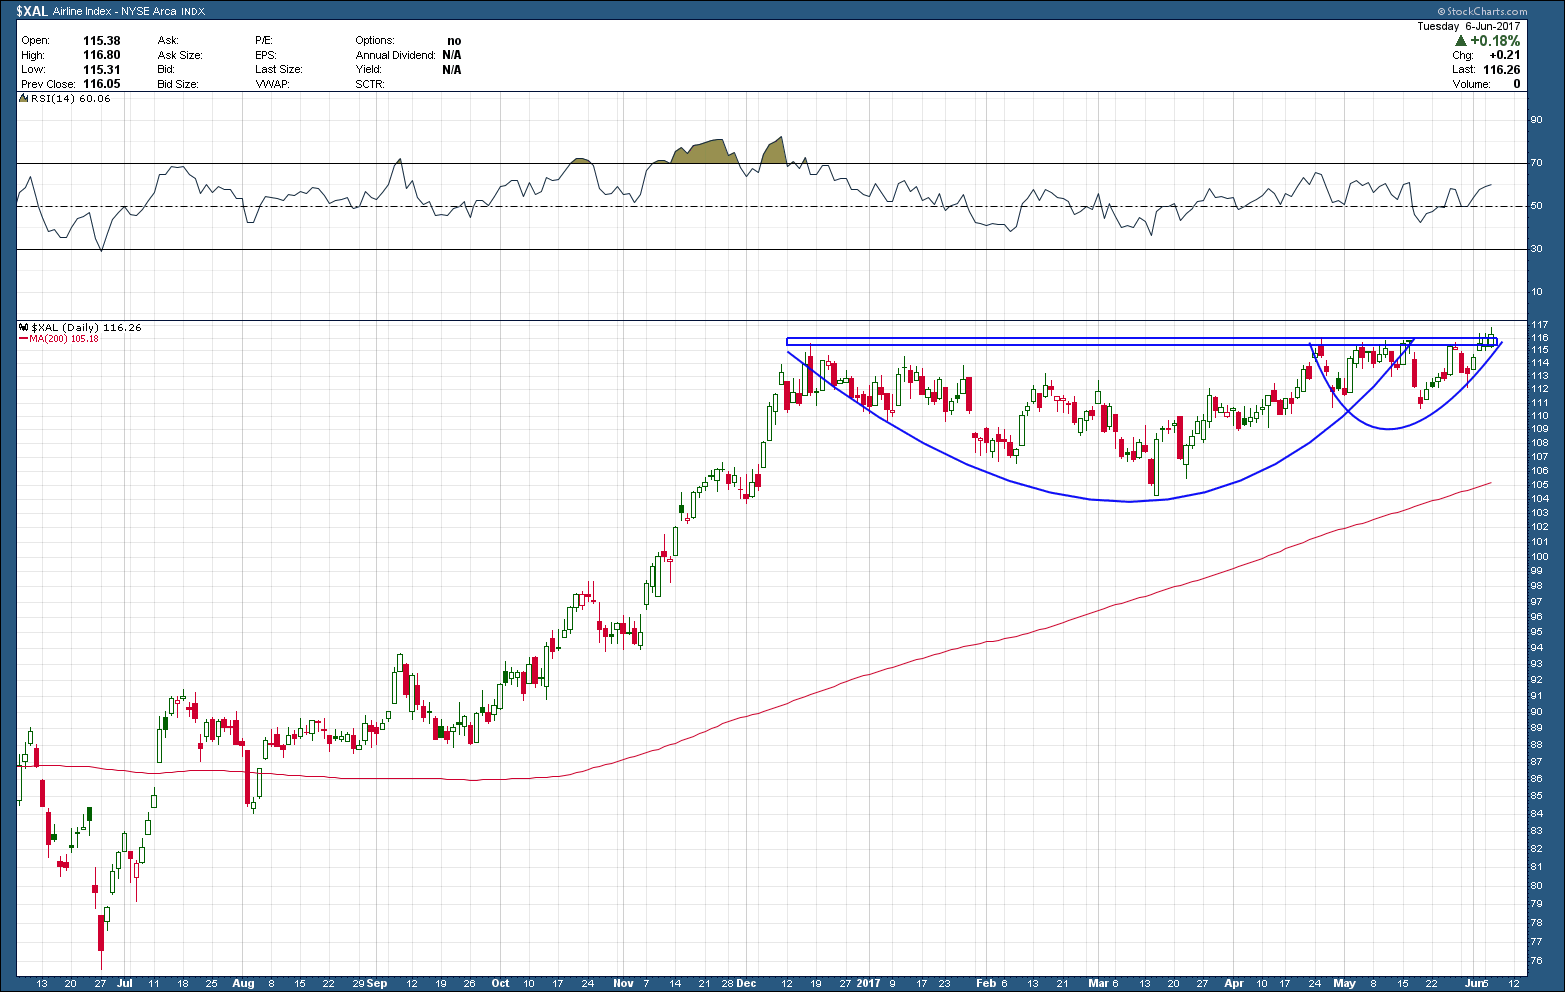
\While the pattern’s upside, if played out, points to a 10-12% gain which isn’t bad, what has me more interested is the width of the consolidation base. The old saying the wider the base, the higher in space indicates the potential for a much bigger run, should the market have more gas left in the tank and the transports play catch-up.

Will JP Morgan Lead Banking Stocks Lower?

The chart of JPM below mirrors that of the banking sector ETF, XLF. A tremendous rally off of the Trump election, enough to create a very overbought condition closing out 2016.  Since that point, it attempted to rally after a small pullback and actually reached new yearly highs in March.  But on that push, negative momentum was formed and the stock has been grinding lower ever since. As you can see JPM has gone nowhere (dead money) for the past 6 months and has formed a bearish head and shoulders reversal pattern.  If the pattern were to play out its target is labeled T1 on the chart some 12% below todays close. T2 is a support level of significance if T1 does not stick and the market continues to sells off.

San ramon independent cfp fee only investment advisor fiduciary - 5-31-17 -JPM

As investors in any region of the world, we always want to see banking stocks in healthy up-trends, making higher highs. While JPM’s price is still above a rising 200 day moving average, it formed a new intermediate term lower high and lower low warning of a potential trend reversal. Any play out of the bearish head and shoulders pattern would make huge dent in the bullish case for banking stocks. 

As goes JPM, so goes the banking sector.

It’s important to know that head and shoulders patterns which are over-hyped up by the financial media’s lack of understanding of technical analysis and constant need for headlines. When these patterns do actually play out they are a thing of beauty and can be quite profitable for those short. But the fact is these pattern either don’t materialize or fail the majority of the time. Why? its because historically stocks have spent 70-80% of the time either moving sideways or higher and this pattern is a marker for stocks moving down. Back to JPM, from a purely mathematical standpoint we have higher statistical probabilities a decline will NOT materialize. Nevertheless whenever these patterns develop they should not be ignored as they are a warning sign and we need to be concerned just in case it turns out to be one of those 20-30% possibilities.

Are Global Stocks Poised to Run?

Almost 9 years later it appears as if global stocks are ready to break out above their 2008 highs. As you can see in the chart of ACWX below, an aggregate index of global stock markets, excluding the US, is sitting just under prior highs. This area has acted as resistance and was rejected the past 3 times it tested it from below.

San Ramon Bay Area retirement planning CFP independent fee-only financial advisor ACWX

It is said the more times price tests a certain level the more likely it is to break through. If the 4th time is the charm, it would add another feather in the hats of stock market bulls. While the US broke out years ago, most countries around the world have not. As such a breakout would send a strong message and confirm investors strong risk appetite.

The Wall of Worry

It is said the stock market climbs a “wall of worry”. This expression was coined in the 1950's and depicts a sustained stock market rise during a time of economic, financial or political stress in which stock prices are said to be ascending a "wall of worry".  What greater stress is there than having a nuclear-armed, narcissistic nutcase as your nearest northern neighbor?

It appears as if South Korea has been able to overcome this wall as you can see in my chart of their stock market ETF proxy, EWY, below. It had been trapped in a huge 7 year, 35% sideways range, going nowhere offering buy and hold investors little to no stock market gains. But all that may have changed 3 short weeks ago.

Fee only independent  CFP. retirement income and financial secuirty experts - 5-24-17 - ewy

As you can see, price gapped above long term resistance on more than a 50% increase in volume (lower pane) on the breakout which also pushed momentum (upper pane) into the bullish territory for the first time in many, many years. This is all very constructive and opens the door for additional and possibly significant future gains.

Even with the very positive outlook the charts are telling us as a backdrop, do your inner spidey-senses continue to tingle knowing you could be one bad hair day away from “a merciless sacred war” that will turn Seoul into “a sea of fire” or “reduce it to ruins with weapons of absolute justice”? If this were to happen I would guess it just might be one wall their stock market might not be able to climb. I don’t know about you but for now I am going to err on the side of caution and watch this all unfold from the sidelines in spite of the opportunities it presents.