Beating a Dead Horse

I do keep a regular pulse on the precious metals market and I continue to be amazed at the resiliency of the (remaining) gold bugs in spite of the drubbing they have taken since the 2011 highs. We have seen repeated bottoming attempts only to have the rug pulled out and prices fall further throughout this entire 5 year decline.

Fast forward to July of last year. You can see in the chart below of the small cap miner ETF, GDXJ, price first found a bottom in the $18.20 area, chopped around and created a higher high in October giving the bulls some hope. Notice also, how that same $18.20 provided support during the entire 6 months + consolidation as it retested it many times. Sadly, the bulls hope was squashed in December as the next impulse move higher was lower than the previous, wiping out the hope for a new uptrend. The final nail was put into the coffin on Friday as the $18.20 failed support and prices are following strongly through to the downside today.

Bay area financial advisor secure retirement planner, cfp 1-20-16 gdxj

Unless there is some catalyst and we reverse back up here in the next few days, I see another plunge in the works. The head and shoulders pattern that was formed projects to a target around 15, some 17%+ lower than where we were on Friday. I don’t know if that will be it, but because of the carnage that has already taken place, I will be looking for the next flush down to be its final and the potential beginning of a reversal. But for now, the charts are telling us the bears are in charge and making money will not be done buying or holding.

R.I.P Glenn

My first concert I saw the Eagles 7-2-77 at the Oakland Coliseum, day on the green. I was hooked ever since.

No prescient words could ever be written that were more fitting for your passing. Glen, you had an impact on my life, may you rest in peace.

A perfect day, the sun is sinkin' low
As evening falls, the gentle breezes blow
The time we shared went by so fast
Just like a dream, we knew it couldn't last
But I'd do it all again
If I could, somehow
But I must be leavin' soon
It's your world now

It's your world now
My race is run
I'm moving on
Like the setting sun
No sad goodbyes
No tears allowed
You'll be alright
It's your world now

Even when we are apart
You'll always be in my heart
When dark clouds appear in the sky
Remember true love never dies

But first a kiss, one glass of wine
Just one more dance while there's still time
My one last wish: someday, you'll see
How hard I tried and how much you meant to me

It's your world now
Use well your time
Be part of something good
Leave something good behind
The curtain falls
I take my bow
That's how it's meant to be
It's your world now
It's your world now
It's your world now

“It's Your World Now”
Written by Glenn Frey and Jack Tempchin
From the Eagles’ Long Road Out of Eden album

What is Up With the Yen?

I got a call from a friend last week. She asked me about the yen and what I thought. I don’t look at currencies too often as they are pretty illiquid and minimally available in the securities market where client brokerage accounts are held. Additionally, no one will become rich investing in currencies in brokerage accounts so I tend to focus investment attention on stocks, bonds, some commodities and hard assets. Trading currencies is best done via FOREX markets because of the leverage they bring.

Being the natural skeptic I am, my immediate thought when she mentioned it was the yen, really? The dollar is so strong (right now) and the yen so weak there is no way! I pulled up a chart and was pleasantly shocked at what I saw because she was right. As you see in the chart below the yen has been basing for more than a year and has formed an inverse head and shoulders reversal pattern. Last week’s close was just above the neckline and what I would consider as a decent entry point upon confirmation. Add to that it has created higher highs and higher lows while price has risen above a flattened 200 day moving average which looks like it is now starting to curl up. These are all positive and things I need to see before I consider investing in something that has been in as severe a decline as the yen has. I do have my biases and would consider this a “trade” and not investment. I say this because fundamentally I don’t see a rising yen lasting as the Japanese government and central bank are doing everything possible to weaken it and until that changes I think it is doomed long term. For clarity, the difference between a trade and an investment is the time frame. A trade will be shorter in time, likely be a year or less probably months (they have even been as short as a few weeks) and an investment, longer. I prefer to avoid “trades” and hold out for “investments” in client accounts whenever possible.

As you know I try to not spend a whole lot of time on why an investment is doing what it is doing but in this case I am going to as there is a valuable lesson to learn and keep in mind. With the fundamental backdrop being so negative for the yen one has to wonder why it would be moving in the opposite direction it should be. Historically the yen is considered a safe haven (much like the dollar) during times of (stock) market stress and it appears that Mrs. Market is once again remembering that correlation

Bay area fee only independent financial advisor, retirement planner , CFP 1-18-16 FXY

Because the yen and stocks move in opposite directions, I would expect this yen rally to have some legs as I don’t think we are anywhere close to being done with the stock market decline. But once we are, I think this trade will likely have run its course.

Ay Carrumba

In June of last year I wrote about the double top in Mexico’s stock market ETF, EWW and the (blue) bear flag that was forming which I posted in the chart below. You can see at the time, I labeled the breakdown target from the flag with a black horizontal line which came in around the prior 2011 lows at ~$45. This projected to a 20-25% loss depending upon where you measured the starting point from (the top or bottom of the flag)

Bay area fee only financial advisor investement manager 1-14-16 eww #0

Fast forward to today with an updated chart below. You can see we hit the target not once but twice and sit just above the line.  This confirms how important this price as support as it has now bounced off 4 times over the past 4 years.

Bay area fee only financial advisor investement manager 1-14-16 eww #1

For those that followed along, congrats but it’s time to lock in the 20+% profit and move on. But is it? You see, when prices are strongly trending (in either direction) many times once one pattern has completed another one forms and EWW is no different. In this case we have now formed a very large, bearish complex head and shoulders topping (in red) pattern which brings with it a much larger potential for profit if it breaks down and you are short. A break and confirmed move below the neckline could be the beginning of the start of its next leg down. While it is hard to write this because it seem so implausible,  the pattern target projects down at around $20, some 43% lower than where we sit today and back right at the 2009 lows. If this works out all I can say is Ay Carrumba!

Double Diamonds

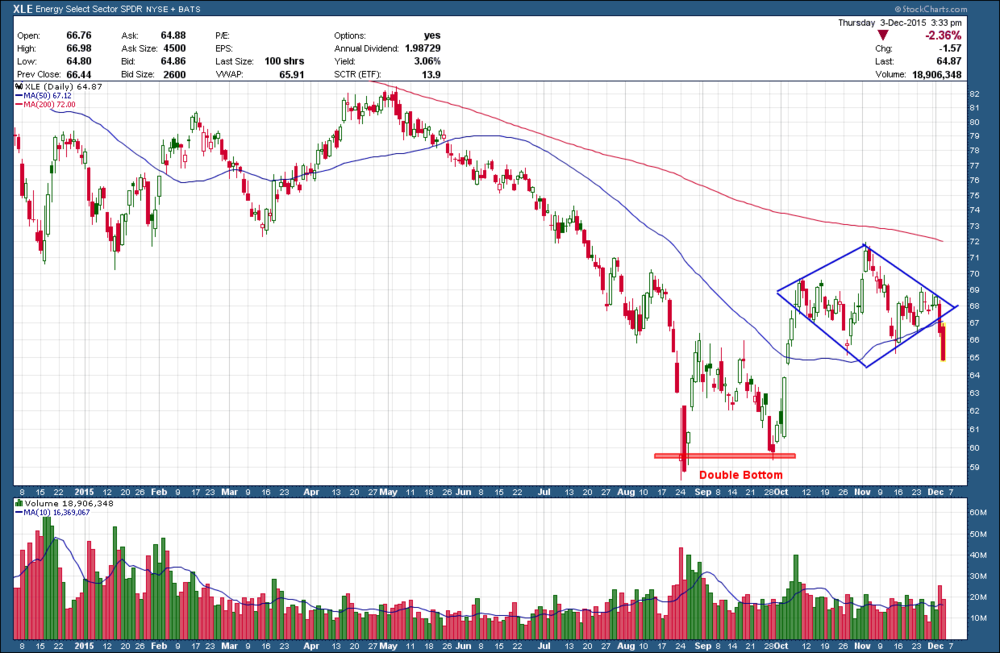
On December 4th I wrote about XLE, the energy ETF breaking out to the downside from the diamond reversal pattern which pointed to lower prices ahead. I stated “the pattern target is back down at the prior double bottom lows around 59 1/2.  I would expect short sellers to jump on board and add more strength to the downside so I would not be surprised by an overshoot of the target.”

investment advisor bay area financial advisor certified financial planner CFP

Revisiting an updated XLE chart below we can see that price bottomed at $58.85 nicely within the targeted area. Once it hit this level it found support (as expected) and began consolidating. Interestingly, during this consolidation it formed another diamond.  Not quite as symmetrical and pretty as the first, but a diamond nonetheless. This is the first time I have seen consecutive diamonds so I am not sure what additional significance if any it provides but I thought I should mention it. As you know, diamonds are usually reversal patterns but investors are best to wait for confirmation to see which direction price actually moves once out of the pattern before they put money to work (they are just back to back triangles which we don’t trust) . In this case, it appears as if it is not a reversal but rather a continuation as price broke, once again, to the downside. The target for this pattern is the width of the diamond subtracted to from its breakout price which, as it turns out, is at today’s lows.

financial advisor bay area investment advisor retirement planning specialist

Anyone who followed my recommendation is up as much as 22% depending upon their entry and should consider booking profits. I prefer to present blog ideas as they happen rather than after the fact. Unfortunately, this started to unfold as the overall market begin to unravel. In either case it can be used as a good learning tool for how to manage and invest in diamond patterns.