Bonds ... Where to From Here? Rev 2.0

Back in January I wrote about the US long bond forming a symmetrical triangle pattern. Because of their fickleness I was not confident on the direction it would take (I leaned to the upside) but the pattern suggested a 10% move, whichever way it broke. I took a lot of flak on my contrarian lean to the upside direction as everyone was confident future FEDs action would push rates higher (and bond prices lower)

Financial and retirement planning experts bay area Pleasanton - 3-9-16 - TLT

Bringing this chart up to date you can see price did break to the upside and the move (from breakout to peak) hit its 10% target in just 5 short weeks. As Hannibal Smith from the A-Team used to say “I love it when a plan comes together”.

Independent financial advisor bay area - 3-9-16 TLT Current

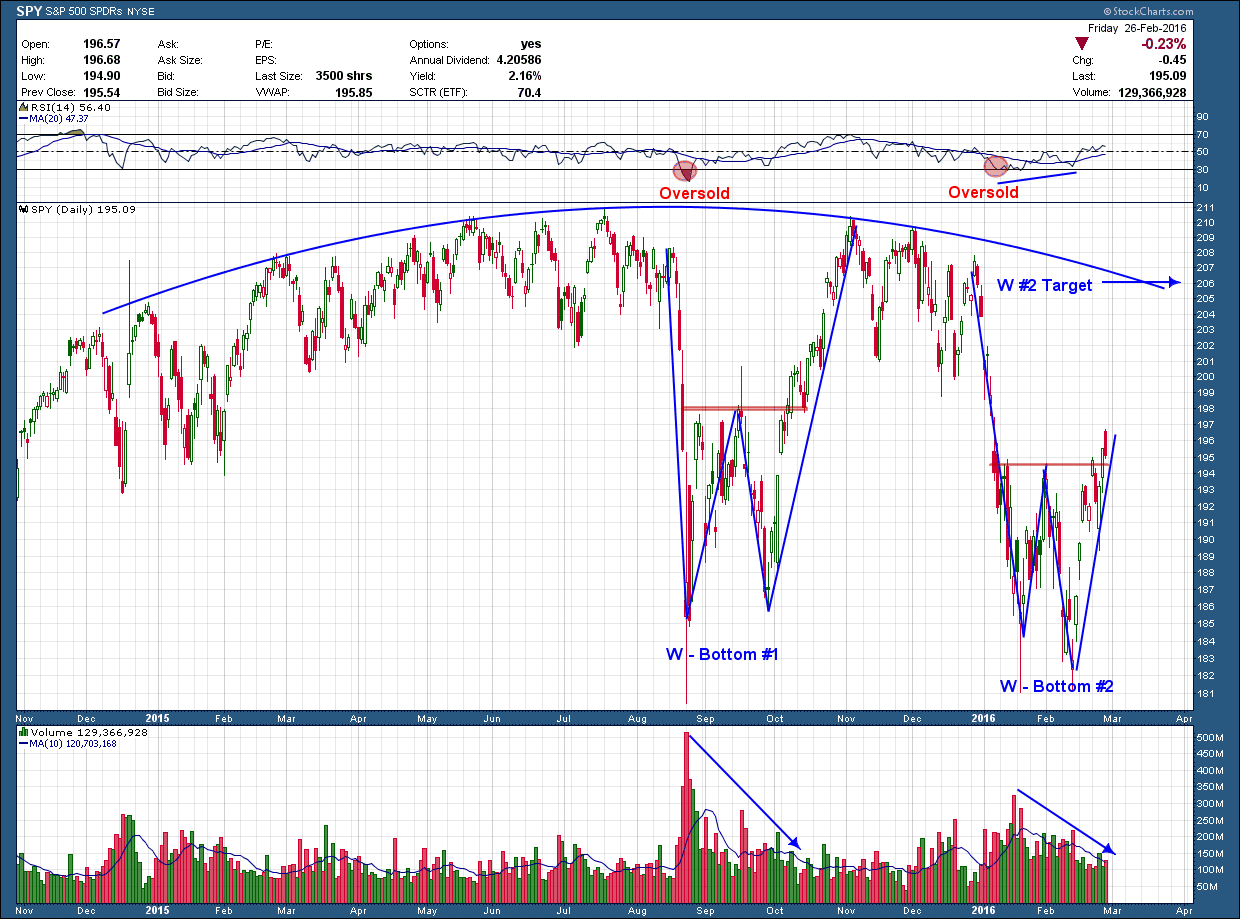
Because the fundamental backdrop has not changed and this move was “contrarian” it is important, once a move has completed its projected move, to take some (if not all) chips off the table and review the charts for clues about what may lay ahead.  To do this, I find it best to shorten your perspective and look at a daily chart.

Fee only bay area investment advisor - 3-9-16- TLT Daily

No matter the chart I see patterns and this is no different. The current setup has the appearance of a bull flag. It became overbought (RSI momentum in upper pane) and needed to unwind that condition which it has and still remains in the bullish zone. The red 200 day moving average has begun to slope upwards. As such, I would be interested in this security if price breaks above the upper blue boundary of the flag as the upside pattern target is another 8-10% higher. To confirm a break, I would like to see it occur on higher volume.

If, on the other hand, prices breaks down below the lower blue flag boundary or if it doesn’t break higher within the next 5-10 trading days, all bets are off.

Solar Guy

I am a big fan of solar energy and as an investor watch it closely. For the most part it has not been a great long term investment (but can be a good trading vehicle) as it is a commodity business and as such tends to put limits on upside potential. First Solar (FSLR), one of the leading solar manufacturers has had an impressive run rising more than 500% from its 2012 bottom, peaking in March of 2014 near $74. Since then it has been consolidating sideways in a $35 channel and has retested the $74 resistance 5 times and been rejected each time.

fee only investment advisor bay area independent wealth management

My take on the chart is that it is presenting a very attractive setup here as

1.      Price is above a rising 200 day moving average.

2.      RSI momentum is in the bullish range and is rising with plenty of more room on the upside if it wants to run.

3.      While not a reversal, it has formed a bullish W pattern

A technician’s adage is the wider the base the higher in space which is relevant to FSLR here. Put simply it means the longer a stock consolidates the bigger the move once it breaks out of that consolidation. With more than 2 ½ years of sideways chop this stock is setting up for a big move. Of course, they never make it easy as the market never tells you which way the move will be (up or down). But as of now the signs point to it being higher.

While the setup is in my opinion excellent and the upside it may have is very attractive, it has not yet provided a buy trigger. For me that would come on a confirmed (which includes many things, not the least of which is on significant volume) breakout above horizontal resistance so don’t mistake my bullishness as a recommendation to load up here.

I can’t end this post without the reminder that all opportunities have the chance to fail and it is imperative a plan based upon your risk tolerance and time frames on how you will manage the position should that occur be in place BEFORE you enter.      

Double You

In spite of Friday’s ugly close, the bulls took control of the market last week as the SP500 gained a bit more than 1.5% and closed above major resistance.

I talk about patterns repeating themselves and wanted to use today’s post to point out an example that is unfolding in front of us right now in the US broad market index. Notice in the chart below of the SP500, the first correction that started in August of last year formed a W bottom.  The first leg of the W created an oversold condition in RSI momentum. The upside target of a W pattern once confirmed is the height of the W underneath the (red) neckline added to the neckline. Using the right leg of the W to calculate the target, price eventually came within 5 cents of hitting its target. Once the target was hit price began to consolidate. But notice that during consolidation, instead of making higher highs like it did to during the consolidation (reflecting strength) to the left of the W, price struggled as each successive high was lower than the previous. A sign of weakness

Eventually strong selling again overtook the market and the second correction began in earnest as we welcomed in the New Year. Like the first correction, this one formed another W bottom. A couple of significant and important differences that needs to be pointed out with this W is

1)      The bottom of the pattern started from a lower point and

2)      The second leg of the most recent W pattern started from a lower point than the first leg whereas the in the first W, the second leg started from a higher point than the first leg. Again, another sign of weakness

independent financial advisor bay area fee only CFP

On a positive note this week, price broke out on higher volume and closed above its (red) neckline. If the bulls retain control I would expect a repeat of the path of the first W and we move higher. I have indicated the target of where that pattern projects but expect it to fall short of fully reaching it. Even if it reaches its target or slightly beyond as long as it stays below the end of December's high, it will again have made a lower high which is confirming the thesis we are in a downtrend and caution is warranted as we would expect to see lower prices later this year.