Oil Conundrum

The short and intermediate fundamental term outlook for oil prices continue to look weak as demand falters and supply continues to be robust. Just last month the International Energy Agency provided the following bearish backdrop forecast for future oil prices:

“The surplus in global oil markets will last for longer than previously thought, persisting into late 2017 as demand growth slumps and supply proves resilient. World oil stockpiles will continue to accumulate through 2017, a fourth consecutive year of oversupply.”

And yet I can hardly find a more bullish chart than that for oil. The 19 month, 75% (peak to trough) drop in price, came to an abrupt end in February of this year.  Notice how, during the decline, positive divergence formed in the upper RSI momentum pane on each successive low. After putting in a hammer candlestick bottom on Feb 16ths close, price reversed strongly and powered higher, pausing for a brief breather just after piercing the blue downtrend resistance line and eventually peaking at the logical ~$50 (prior resistance) level.

Bay areas best investment advisor and cpf independent fideuciary - WTIC - 10-24-16

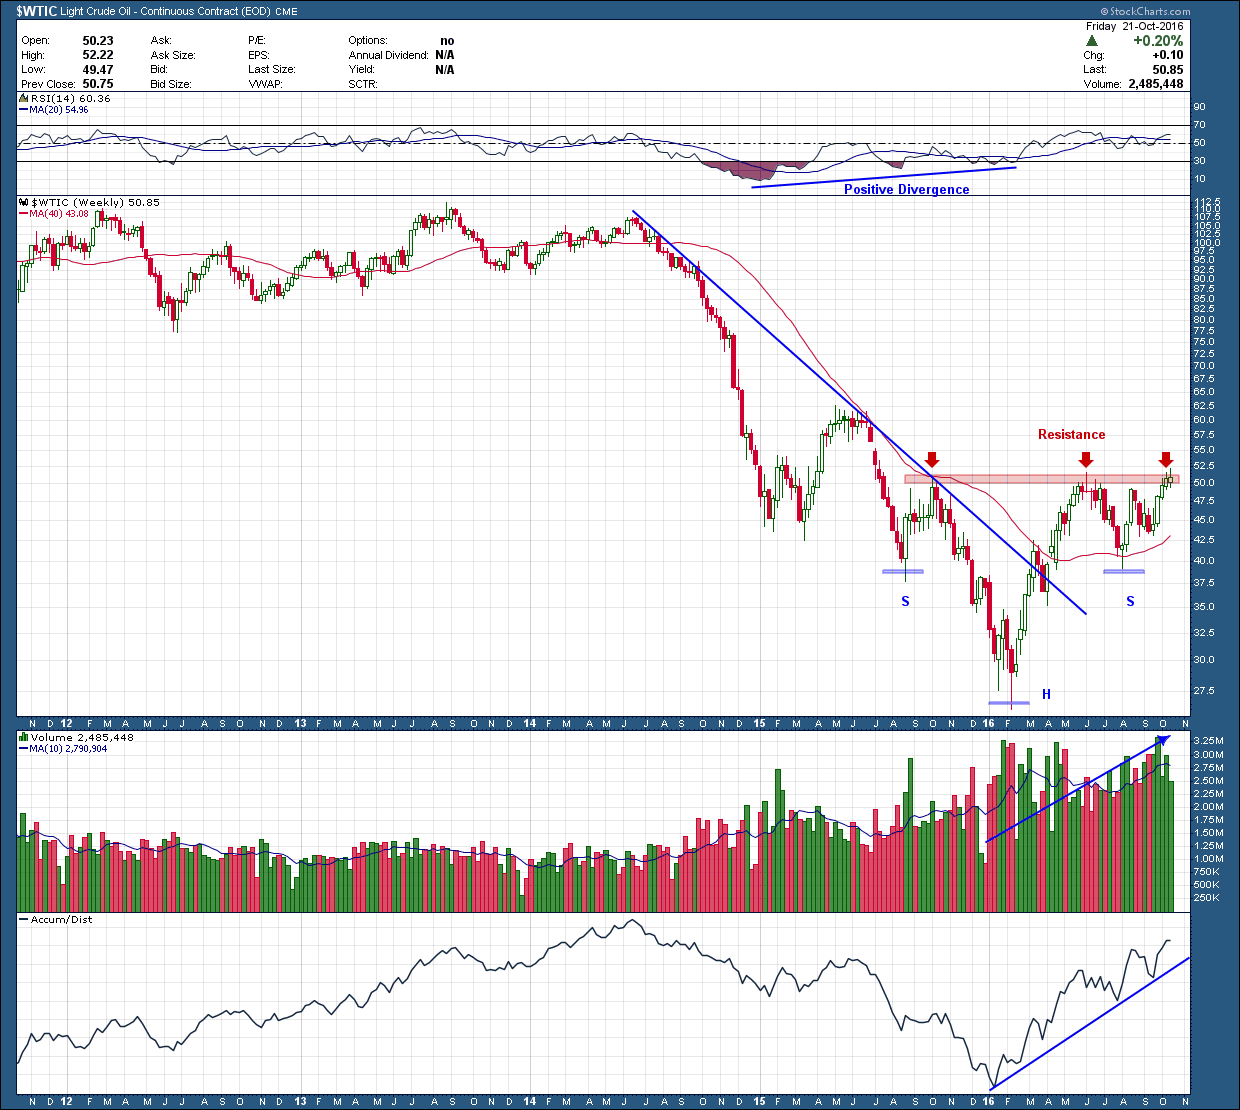
After a healthy correction off $50, oil is once again to break through critical resistance.  As bulls want to see, both volume (3rd pane) and the advance/decline line (bottom pane) have been increasing from the Feb. bottom confirming the strength and legitimacy of the move. Additionally, price is holding above a rising (red) 200 day moving average. Hopefully your eyes are becoming trained to look for patterns and were able to notice, without the aid of my annotations, the inverse head and shoulders bottom that if confirms and plays out to its target, projects to the $75 level.

Investing is so much easier and provides greater success probability when the stars and planets (technical and fundamentals) are aligned. But since this is not the case here what is an investor to do? Depending upon your risk tolerance one option would be to move on and wait for the ideal setup where all signal align. Another would be to wait for confirmation and jump on the opportunity but manage risk via both a reduction in position size and loss acceptance (exit strategy).  Whatever your style, the markets rarely provide “slam dunk” opportunities and when they do you’ll often find Ms. Market is playing you.

 “If you can’t find the sucker at the table, you’re it.”

Biotech Stocks on (life) Support

After peaking in July of last year, the biotech sector ETF, XBI succumb to massive selling pressure and fell some 50% in 7 short months, bottoming in February, earlier this year. Since that time price has made a series of higher highs and higher lows advancing within a (blue) rising channel. 

Recently price, once again, bounced off the upper channel resistance, this time while momentum warned of the potential for near term consolidation as negative divergence raised its ugly head for the first time since finding a bottom. Friday’s close coincided right at the critical lateral $60 support zone (note the number of prior tests (red arrows) indicating this level is a historical bull-bear battle zone) and slightly above the rising channel support and falling 200 day moving average.  This is a great example of a confluence of signals.

independent bay area cfp fiduciary financial advisor 10-16-16 -xbi

It's put up or shut up time for the bulls right here. Another down day like Friday will push price below all key supports and open the door for further downside probing. The pattern’s target, if it should breakdown, is back at the $50 level. If the overall market wants to pile on by selling off at the same time, a retest of February’s $44 low would find the next wave of potential buyers.  Biotech stock owners should be on full alert right here we are soon going find out if the current level acts as support and price reverses higher or gives way to the next wave of selling and lower prices below.

“Semi” Short

I use the semiconductor ETF, SMH, as my go to chart when looking at old tech. Semi’s have been around for 30-40 years, most all have excellent business models, pay a dividend and provide strong and growing cash flow.  A look at the current weekly chart of SMH shows price has been in a steep uptrend since the start of the year and has formed a bearish rising wedge. During this ascent, price has bounced off the converging trend lines the requisite 5 times, sits very close to the apex of the wedge all while momentum has formed bearish divergence.  While not a death nail, this pattern is warning of something that has come too far too fast and needs at least a rest, if not more. When combined with the other evidence, I find this a potential compelling short setup.  Any break below the lower rising support with confirmation would be the signal a correction is has started and to expect further downside with a target of about 9 points or 13% below.

Don’t take this post as a suggestion, recommendation or an endorsement to short SMH because there are no guarantees as this, like all patterns can fail. Shorting strong stocks (or most any stock in a bull market) is a great way to lose money if you don’t have a system to manage the position in case you are wrong.  Being wrong is a normal part of investing, staying wrong and losing a lot of money in the process is foolish.

Some struggle with the part about being wrong. You shouldn’t. The best investor/traders I know are wrong between 60-70% of the time but they make a ton of money. Why? Because they have a plan and make sure they aren’t wrong for very long.

best independent bay area financial advisor 10-12-16 - smh.png

And speaking of failed patterns, right here on this same chart is a great example. From the middle of 2014 through the entirety of 2015 price formed a head and shoulders reversal pattern which warned of lower prices. The downside target if the pattern played out was about 30% below Jan 2016’s low. Anyone that attempted to short this stock without waiting for confirmation would have been wrong and lost a bunch of money. As is typically the case, once a pattern fails it can becomes a powerfully strong investment in the other direction. In the case of SMH, on confirmation of the patterns failure in May, price rose 25% in 5 short months. This is a great example of two important technical analysis tenets 1) never invest in a pattern that has not yet confirmed and 2) do not give up on an investment if a pattern fails as it is likely to give you very strong gains in the other direction.

Weak Coffee

Starbucks has had a wonderful run over the past 5 years, rising more than 200%. Over this time frame it, as you can see below, went through two major upward thrusts and (now) three consolidations. Each of the prior consolidations lasted about a year. The first one in 2012 was more had a more downward direction as it lost almost 30%. The second one which started at the end of 2013 was more of a sideways move as it lost just 17%. The good news for SBUX investors was that each consolidation resolved to the upside.

Fast forward to today and you can see the weakness in price and the fact price is stuck in another consolidation. Looking like the last sideways consolidation (at least so far) as it has muddled along for not quite a year and has lost 16%. RSI momentum in the upper pane shows this is the only consolidation that started off with a negative divergence warning. Also, price has formed lower highs with each thrust higher while the $52-$53 area has acted as significant support. Finally, the descending triangle pattern that has formed warns of continued weakness.  Those long SBUX need to be concerned that while the current level has held 4 times in the past, the more times price touches a level the higher the probability it will break through (in this case to the downside).

All in all, like so many stocks right now, SBUX is at a crossroad. A break above the descending triangle resistance line and we are likely off to the races and in for another big run higher. A break below (red) support with confirmation, a test of the ~$41 level, some 20%+ lower is the pattern's projected downside target.

bay area independent cfp financial planning advisor 10-5-15 sbux

Those already owning SBUX need to keep a close eye out for a breakdown below both (red) horizontal and blue rising support as that would provide a high probability we see weaker SBUX prices ahead.