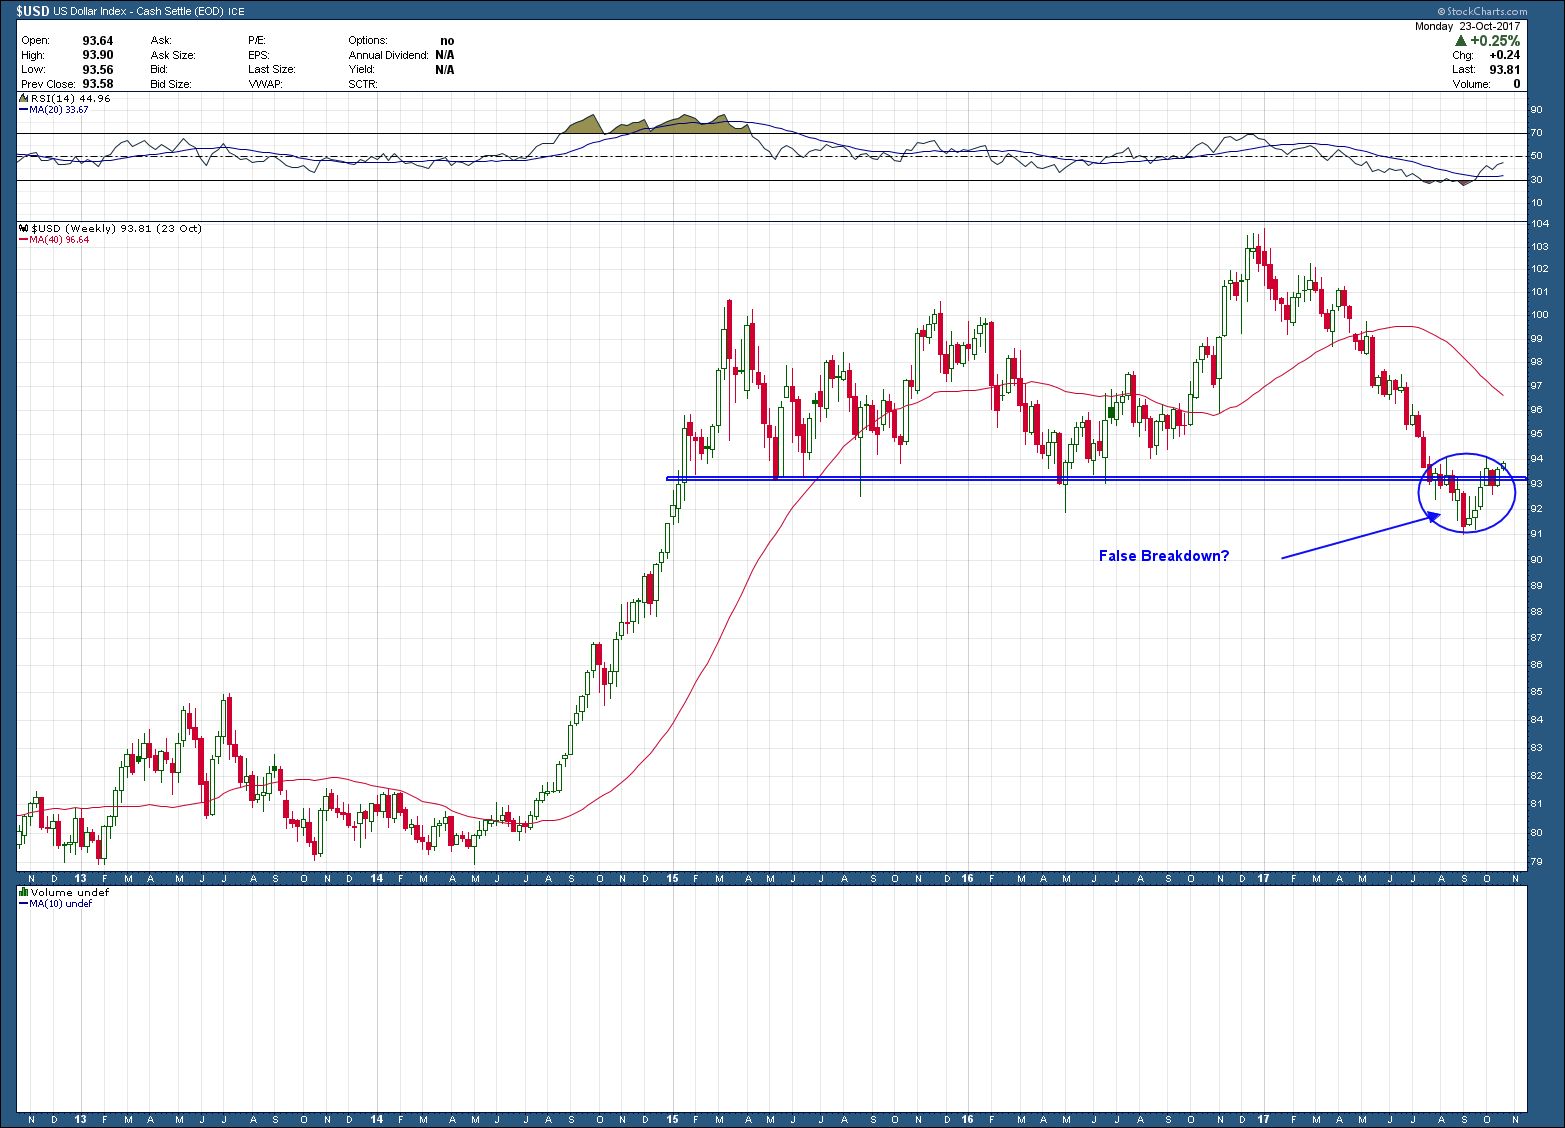
The US Dollar has been beaten up since peaking in December of last year, as it has lost more than 12% since then. I have been a strong dollar bull advocate since its breakout in 2014 but the recent consolidation with a breakdown below horizontal support at $92, forced me to throw in the towel. From a technical standpoint you can see in the weekly chart below how one could draw the conclusion $92 was the last bastion of support before a complete breakdown was imminent. Well, as it turns out that is not completely correct. As I mentioned in my video, when prices breakout (up or down) from major areas of support or resistance, one needs to be aware of the possibility it turns out to be a fake out. A false break. False breaks usually bring powerful rallies in the opposite direction.
Using longer term weekly charts help identify direction and POSSIBLE reversals but it is imperative to use shorter term views to zero in on for early confirmation and better entry/exist points. As you can see in the daily chart below, the dollar has formed (but not yet confirmed) an almost perfect symmetrical inverse head and shoulders reversal pattern while printing a divergent RSI momentum low. The pattern, if confirmed and plays out, points to an upside target at T1.
The bottom line here is if the dollar begins an intermediate term rally, investors need to understand the potential negative ramifications a rising dollar has on owning investment that typically move inversely such as commodities, other currencies, precious metals and foreign investments. But because at this point the current setup is nothing more than a warning shot, it warrants keeping a very close eye on and keeping an open mind to a resolution in either direction.

