
Impressive moves from Christmas eve lows have the worlds stock markets very extended.. Typcially, prior highs act as formidable resistance, will they again? Or, will this be the mother of all rallies that ignore those levels and slice right through? Something to ponder as you listen to my most recent charts on the move video.
Got Gas?
The price of Natgas has had a tough time of it since peaking in November of last year as it has since fallen a smidge under 50%. Looking at its chart, it becomes immediately noticeable that it has just reached a very important past level of support. Other than the one time in 2015 when the price pushed lower, this $2.5 area has been a zone of strong support as its price has rebounded each of the past 7 times it has been tested.

If an investor wanted to take a nibble here assuming this level will once again act as support, the reward-to risk level is extremely high, well above our 3:1 target with a clear exit if natgas closed and held below $2.4.
Digging a little deeper to try and find a way to increase the edge, taking a look at seasonality over the past 20 years in the chart below, we can see that buying and selling Natgas in February has not provided that edge. Only 45% of the time has Natgas closed higher at the end of February than it was at the beginning. The other perspective is that buying now and holding through April has historically provided a much higher probability for success. Bottom line is, if this investment is worthy of your investment capital be prepared to be patient for any payoff as that will likely occur in April.

Maybe This Year
On Jan 2, 2018 I walked into Melanie’s office and told her I had set a goal for myself to see if I could double my small, trading account IRA account in one year (achieve a 100% return). An ambitious goal but something that is doable with good risk management, some leverage, active trading and of course must include a dash of luck and a cooperative market.
With 2018 now in the rearview mirror and a tally of the results I have to come clean, I did not achieve my goal. In fact, I was far below it. Disappointing no doubt as at one point in the year I was up more than 70% with about 40% of the year left to go I thought it was going to be a slam dunk. I had it all mapped out, I was going to sell everything once I hit that 100% mark and sit in cash and wait for December 31. But, alas, Q4 happened. I didn’t react fast enough to the rapid change in sentiment and so I fell hard with the market. Deal with it big boy, the market is talking and doesn’t care what I want or think. Oh yah, the “Woulda-Shoulda-Coulda” game is a waste of emotional and brain capital too so don’t do it. Its non-productive. If you don’t like the results, change your process.
My return for the year was 25.7%, not bad as I outperformed the SP500 by almost 32%. But those that know me understand “not bad” is not what drives me. So, being the uber competitive individual I am, I will, once again, set another goal to double my account for 2019. The odds are I will fail even worse than I did this year. Why? Because I am human. 2018 provided me the opportunity to fly under the radar with only one person knowing my goal. No external pressure or embarrassment if I failed, just my pride was at stake. You see the sad thing is as humans we have a tendency to act differently the more sets of eyes that are scrutinizing what we do, especially when money is involved. Even though I have the same set of trading rules, because of emotions that drive decisions, I am more than likely going deviate from them even though I know I should not***. Hopefully my genetic stubbornness, adjustments to my process and most importantly my real goal for doing this can keep my emotions in check. I want to make it clear, if I achieve the goal it’s not because I want to gloat or brag, or even because I want a bigger IRA (although I don’t mind this), instead I have something that is way more important to me. I want all clients and readers to know beating the market (and hopefully substantially) is doable in spite of Wall Street’s mantra it’s not possible. If Wall Street is too dumb (and this has nothing to do with intelligence) or lazy, that doesn’t mean it’s not possible. Peter Brandt taught me this and it changed my life. My goal is to do that same for some of you.
Let’s be real. Can beating the market be done every year? Nope, not going to likely ever happen every year over a long run by anyone let alone me. All of my mentors and people I follow and compare methodologies and processes with do it regularly, but not every year. Each of them has experienced underperforming years, some terribly so. That is going to occur with random markets, it’s inevitable. And what is a common trait is that those individuals become better when they fail. They key-in on and learn from their mistakes/failures, something all of us should do if we want to get better at anything in life. They are also in a continuous loop, never staying idle or complacent but always improving. To be a successful investor all that is required is 1) have a process that provides positive expectancy 2) insure steadfast discipline following the process, 3) access to multiple markets to invest in (more than just stocks and bonds) and 4) an unwavering desire to outperform (a politically correct way of saying being an overly competitive pain-in-the-^%$.
Maybe this year.
Any doubters feel free to email me as I will be more than happy to provide a validation of trades and account values. And no, in case you were going to ask as others already have, I can’t do this for anyone else’s account. Sorry. On the other hand, if you would like to learn how, please send me an email as I’d love to share with anyone what I have learned (what’s the old Chinese proverb about teaching a man to fish?).
***If you want to learn more about this human trait, there is a really interesting and true investment story you can read, just google the “turtle traders” or email me and I can send you an ebook.
On a Dime
Josh Brown (thereformedbroker.com) is a must follow for those who live and breathe the markets as I do. His post from last Friday says so much, so well I had to repost it. Hopefully it sounds familiar.
On a Dime
The fundamentals of a company, a sector or an entire country’s economy rarely turn on a dime. They improve or deteriorate slowly, and often imperceptibly, over longer periods of time. And when they turn, even the turn itself can seem interminably long.*
The prices of stocks, however, can and do turn on a dime. They move faster and more aggressively than anything happening with the issuer’s fundamentals. And yes, by extrapolation, entire sectors or country stock markets do the same.
The fact that stocks and stock markets can turn on a dime is one of the most frustrating aspects of investing. Just when most investors have told themselves the same story so convincingly and memorably, the story changes. But not everyone is ready to abandon the story they’ve embraced all at once.
This turning on a dime business also makes technical analysis difficult for people to accept. If everything you thought last week is now the opposite this week, why should I listen to a word of any of it? Smart technicians speak in probabilities and not certainties regarding outcomes. They also describe their opinions in terms of if, then:
If ___ comes to pass, then ___ should be the result. But if ___ doesn’t, then ___ becomes less likely.
If that lack of conviction frustrates you, you probably aren’t cut out for markets, anyway.
2018’s market turned on a dime. The difference between momentum in January versus momentum in December was night and day – there’s no chance the underlying fundamentals of the US economy changes to the degree momentum did during the course of the last year. Here’s Jon Krinsky, looking at Relative Strength (RSI), a widely used measure of momentum – it’s my Chart o’ the Day. Readings above 70 or below 30 are considered to be above or below the thresholds of “extreme” momentum, good or bad…
What a Difference A Year Makes
In January, the SPX’s weekly RSI exceeded 90, its highest on record. In December it hit 31, the lowest since 2011. It’s easy to say that 2019 will settle somewhere in between, but a failure to hold above the 50 level on the next meaningful rally would be a negative tell for the medium-term.

To have the highest RSI on record to begin a year and then end plumbing the depths of recent history – that’s quite a turn. It didn’t announce itself, it just happened. In January, there wasn’t a single indicator that could have warned you. The only preparation for this sort of thing is to be armed with historical context – and the history of markets suggests that anything can happen, at any time. Hence the need to build strategies that can endure all events, even low probability ones.
Source:
Formidable Resistance
Baycrest Partners – January 1st, 2019
* there are exceptions to this, of course. one-drug biotechs absolutely can see their fundamental outlook stop on a dime and reverse, from something like a partnership announcement, an insurance company approval, an FDA approval, etc. There are others.
Over-Caffeinated
In my August 22nd post, “A Falling Knife or Opportunity of the Year”, I wrote about the possibility of “one heck of a reversion to the mean profit opportunity” setting up in coffee. What had my interest was the fact it was massively oversold condition, sitting on very important support and most importantly the smart money was long … very long coffee futures.
Here was the long-term chart of coffee futures I posted.
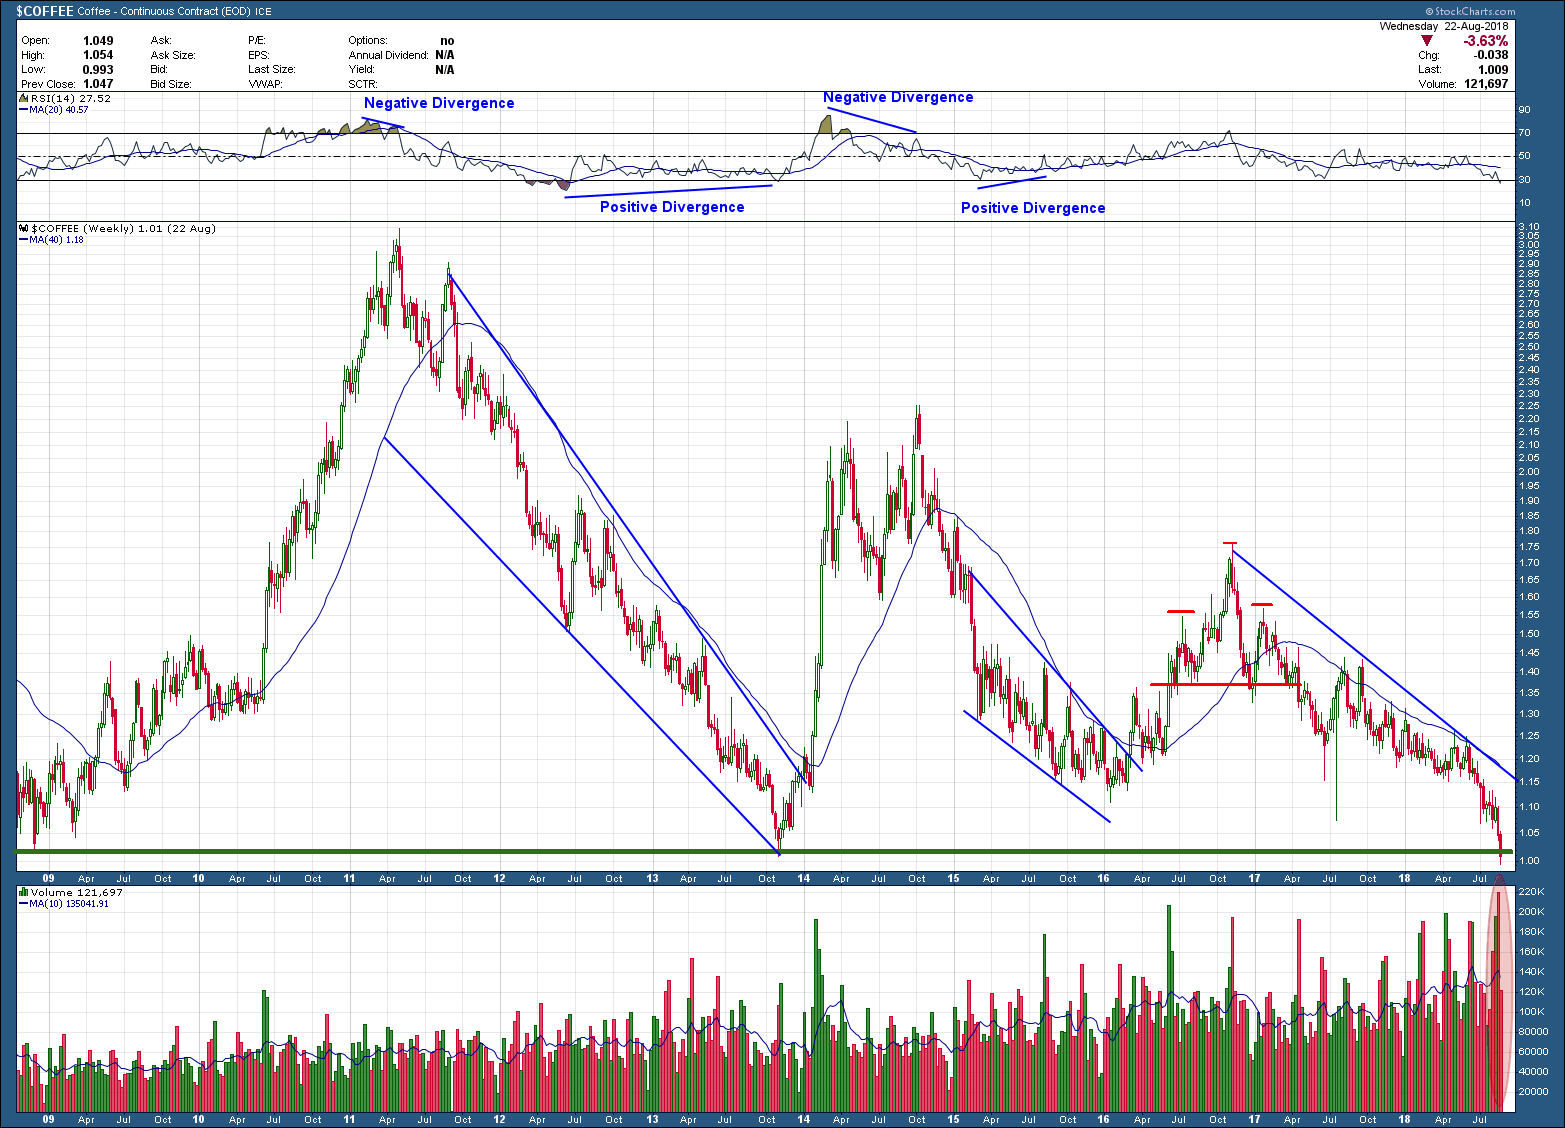
My next chart is what has transpired since the post

Right after the original post, coffee went on to make one lower low in price (which took a month to unfold), at the same time RSI momentum formed positive divergence before coffee’s price reversed course to the upside. What occurred next was a 30%+ rise … in just 22 trading sessions. At this point though it is overbought, run into major overhead resistance (supply), has formed negative RSI divergence and closed last week with 2 indecision doji candles, one being a gravestone. This is enough of a warning for me that the current run is tired and likely done. This type of movement is every traders/investor’s dream and when they occur are usually caused by a short squeeze. For those that are short, when the price of the investment begins to move higher, the higher the price goes, the more investors buy back shares to close out their short positions. This covering is the fuel needed to push the prices higher and higher. Every squeeze eventually run out of gas once most of the short positions have been covered and are usually followed by a big reversal to the downside. So, if you are lucky enough to be on the right side of a squeeze, try and ride it for as long as it wants to go and then get ready to get the heck out of Dodge before the rug gets pulled out from underneath you.