Economy

September 2018 Charts on the Move Video

The bulls were out in force as we closed out the third quarter. With the expected year end rally, 2018 looks to be another strong year for the market…. the US stock market. Bonds, commodities and foreign investments continue to under-perform and act as an anchor to portfolios. Mean reversion will eventually show up but, based upon the charts, Q42018 seems like more of the same.

My Q3 recap video can be viewed in the link below.

https://youtu.be/MgUbcV8Ckb8

Channeling Charles Dow

Stock market bulls should be excited as the Dow Theory triggered a buy signal as the lagging industrials finally broke out to new, all-time highs last week.

San Ramon fiduciary financial advisor and certified financial planner CFP - Dow Theory 9-24-18 .png

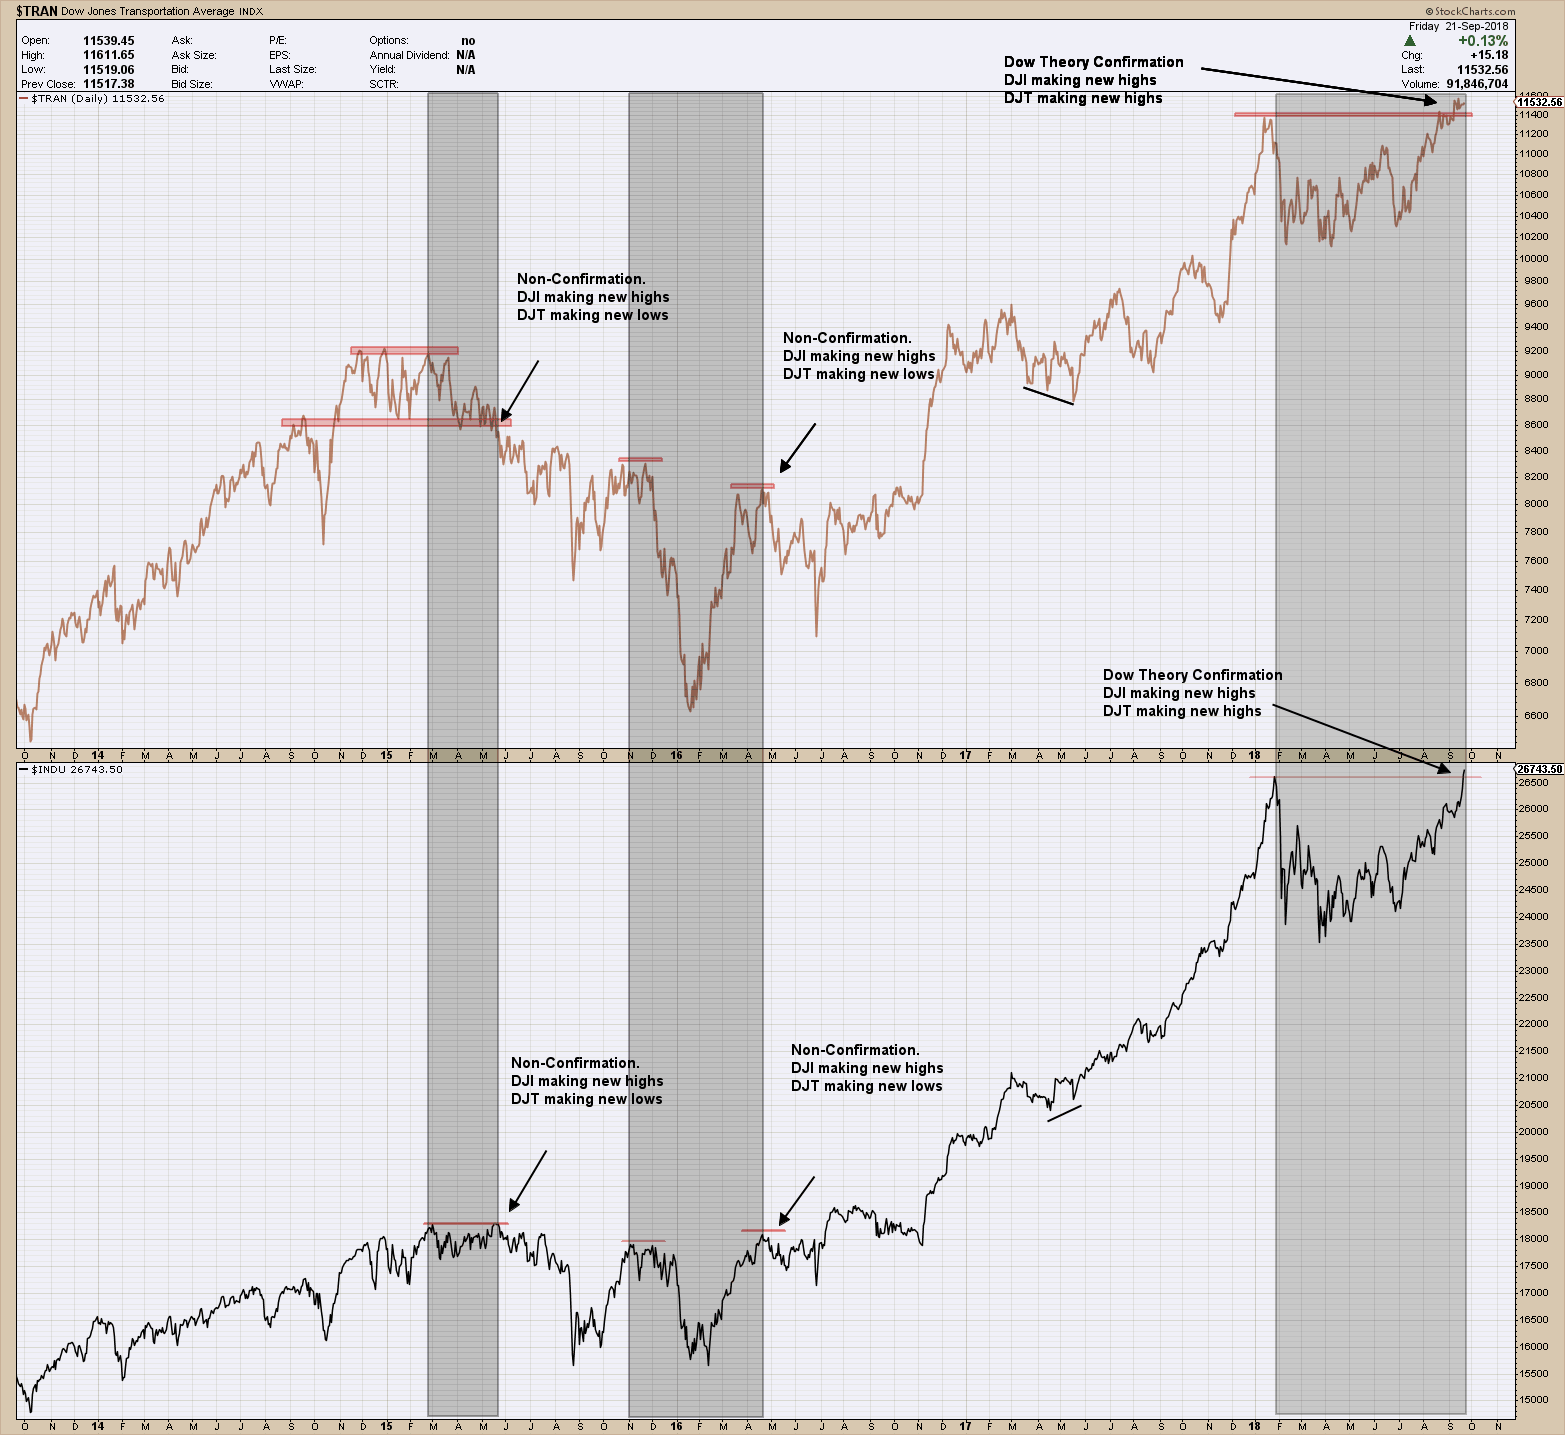
I’ve talked about the Dow Theory here in past blog posts but for those that didn’t read or want a refresher, you can go here.  Like all timing models, it has periods of either out or under-performance. As such, knowing which period you are entering if you are using as a signal is an unknown. Digging a bit deeper at Dow’s theory and its results, it shows some interesting attributes.

  • The “classical'” Dow Theory under-performed “buy and hold” most of the time. All timing systems, and all Dow Theory “flavors” undergo rough patches. Under performance spells also affect the canonized “classical” Dow Theory.

  • However, in spite of such under performance most of the time, over the long term the classical Dow Theory achieves greater returns with a much lower risk.

  • Interestingly, the Dow Theory under performs when there is no danger out there. In good years for the stock market, the Dow Theory, while remaining solidly positive, returns less than buy and hold.

  • The Dow Theory outperforms buy and hold when it is most needed: When stocks are going down. The average annual performance of the Dow Theory when it is outperforming is a loss of 0.95%. However, buy and hold returned in those years a dismal -16.72% on average.

You may be puzzled to learn that the Dow Theory under-performs when the stock market is in a “good” year (namely when it goes up solidly). However, this has an easy explanation. As with any market-timing system, the Dow Theory never gets us “aboard” at the start of a new bull market. At the risk of oversimplifying we can say that 10% of any new bull market is always lost as the bull market always signal comes after its inception. When the market goes up in an almost straight line, by definition the Dow Theory will lag in returns.

However, what results in under performance in “good” times, is out-performance in “bad” times. When the market heads south and buy and hold gives away all the unrealized gains, the Dow Theory does an excellent job in getting the investor out of the market to avoid most of the decline.

Of course, the best environment for the Dow Theory is a long and sustained bull market where the primary bull market swing lasts more than one year uninterrupted. These are the years when the Dow Theory gets aligned with buy and hold as it remains fully invested along the never-ending primary trend. However, such blissful environment (for both Dow Theorists and buy and hold investors) occurred only 29.4% of the time. Furthermore, if markets were always in such a perfect bullish mood, there would be no need for the Dow Theory or any other market timing system for this matter. Investing would be a piece of cake (Yes, markets actually go down 😊)

As the market tends to have more “good'” years than “bad" years, it is not surprising the Dow Theory under performs most of the time. The take away is Its value lies in out-performing when it is most needed: When the going gets tough.

Rarefied Air

Scouring through 100’s of charts it becomes obvious investors have a clear idea on which companies they expect to benefit from the current political climate. One that immediately jumped out at me can be seen below in the chart of the Aerospace and Defense ETF, ITA. As you can it has broken out to new highs after consolidating for 6 months and using the 200 day moving average as a trampoline to propel higher. With RSI momentum unwinding during the consolidation, it appears to have a lot of room to move higher before investors need concern themselves with being overbought and expecting a pullback

san ramon fiduciary CFP and fee only financial advisor.png

The pattern’s (rectangle) target is still some $12 higher than where we closed yesterday. Keep in mind targets don’t mean a whole lot when stocks have entered rarefied air (new, all-time highs). As such, I expect ITA to likely ignore and blow right through it as long as this bull market has legs.

Funnymentals

Bull Market 
noun \ˈbu̇l ˈmär-kət\ 
Random market movements causing investors to mistake themselves as financial geniuses.

In spite of my continual poking fun at anyone putting too much confidence into fundamental only analysis, I do fully admit they should be a part of an investment process.  My problem with them is that they really only become obvious when looking in the rear-view mirror. They are horrible for making decisions on timing because once the information is known, the market has already reacted and it’s too late. In spite of that, I do find them useful and include them in my investment process as one element among many. They are of similar value that longer-term charts are. Directions and trends are more easily discernible and so they help to make short term decisions better but only when used with a weight-of-the-evidence approach. 

From a fundamental standpoint we know that, in theory, stock prices are directly correlated to corporate earnings growth. Stock prices move higher along with earnings and vice versa, Below is a chart of a 6 quarter look-back and 4 quarter look-ahead of the SP500 indexes earnings growth.

bay areas only fiduciary certifiedd financial planner and investment management wealth advisor.png

For the sake of argument if we take the estimated data at face value (don’t get me started on estimations and the ability to predict the future), the chart is telling us we will see a peak in earnings this quarter (Trump tax and policy changes) followed by a significant rollback to the long-term average. While I do believe the future growth numbers provided will be wrong, I am certain earnings will mean revert lower. Bottom line is the chart is telling an accurate tale. The when, how fast and how much will only be known in the future though. What equity investors need to determine is what impact will earnings mean reversion have on stock prices in the future knowing their strong correlation?

Seasonality 2x

It’s not the first time I have mentioned September being one of the year’s weakest months for stock returns. It should come as no surprise then that Septembers of the Presidential cycle are the weakest. What is interesting, is September in the second year has historically been the weakest month in the 4-year cycle.

San ramon napfa fiduciary certified financial planning retirement planner 9-10-18.jpg

It is theorized

  • In years one and two of a presidential term, the President exits campaign mode and works hard to fulfill campaign promises before the next election begins. It is theorized that because of these circumstances surrounding the President's work, the first year after their election is the weakest of the presidential term, with the second year being not much better.

  • This trend of initial economic weakness was thought to be true because campaign promises in the first half of the presidency are not typically aimed at strengthening the economy. Instead, political interests, such as tax law changes and social welfare issues tend to be highest priority.

  • In years three and four of a Presidential term, it is thought that the President goes back into campaign mode and works hard to strengthen the economy in an effort to earn votes with economic stimulus, such as tax cuts and job creation. As such, the third year had often been the strongest of the four-year term and the fourth year, the second-strongest year of the term.

Seems like Trump may throw a monkey wrench in this theory as he seems to have gotten it backwards.  I have been on both sides of seasonality patterns and have found that other than the rare fat tail, a 1.43% average loss is well within normal acceptable market monthly wiggle. This is especially true when you look at the historical patterns that follow September’s weakness… A big rally. Market draw-downs are both normal and healthy so if September turns out to be one, it’s time to put on our big-boy pants and suck it up --- we’re in an uptrend.