
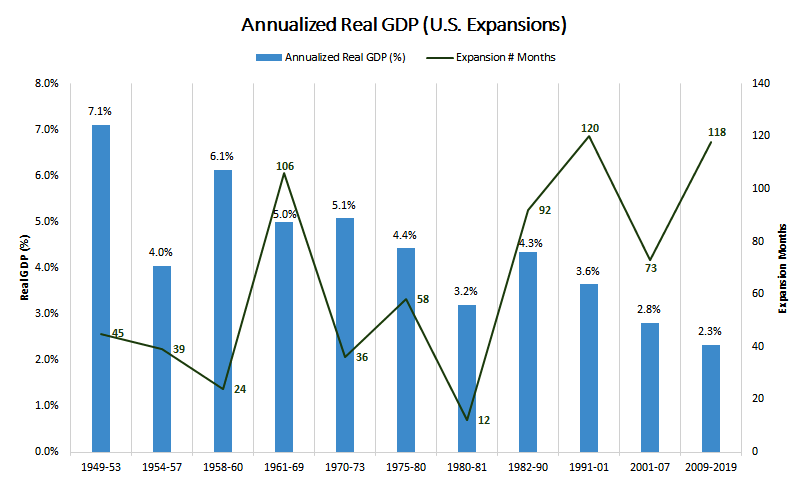
If we can add another 3 months of economic growth, the US expansion from the 2009 financial crisis bottom will exceed the longest in history. What makes this most interesting is that while it will likely turn out to be the longest expansion, it is on target to also be the weakest in history (annualized GDP)
My Favorite
Back about a month ago I wrote this blog post about the developing setup in bitcoin. At the time it had changed character from a steep downtrend to a long extended, rectangular base. This type of price movement reflects the waning of selling pressure and an equilibrium between buyers and sellers. All that is needed for this to be a tradeable investment opportunity is for buyers to begin to step in and take control. Control is borne out by higher prices and confirmed with volume during the break out to the upside out of the rectangle. That is exactly what eventually happened in bitcoin as you can see in the chart below

Rectangles are my favorite pattern because they are, in my experience, the most reliable and profitable patterns to invest from. Because they are so well defined, it makes the management easy and their upside targets very clear. In the case of bitcoin, its upside target was met and exceeded yesterday … a very nice 35% in 5 short days. Congrats to those that followed along and it is time to seriously consider locking in profits for some or all of your position if you have not already done so.
End of Cycle - On the Horizon?
Late in market cycles brings about peaks in animal spirits. Investors are confident and have long forgotten about the previous major market decline. Caution and discipline are an afterthought as they risk their investment capital in places they normally would not. This is normal human behavior. As an aside, investors do just the opposite right after that major market decline. None of this should be no surprise, it is how we are wired.
The chart below shows the number of companies that went public last year but don’t make money came in at 81%, a new, all-time high. Companies don’t have to make money, look at Amazon how many years they went before making a dime. But those companies are the exception, and like hen’s teeth, very rare. The other thing to note is that the last time it was this high was … wait for it … 1999-2000, the top of the dot com bubble. Remember those times when any company with just a business plan and no earnings went public? Most of them eventually followed the fate of the dodo, never to be seen again. Remember those times? Oh, the naiveite of investors back then, right? It’s so easy when looking backwards.

While it’s not 1999 and things are different (they are always different), this time the top culprit was biotech companies. This is not a surprise considering their business model and upfront need for research and product development funding. Second place, were technology companies, another set in the “not a surprise” bucket. Interestingly 'all other companies' came in at a record high. 57% of “the rest” don’t make money.
Add this to a number of signs that are popping up we are late in this business/market cycle. All cycles eventually end. Unfortunately, we won’t know it has ended until we can see it in the rear view mirror. When you add that this to the fact the current cycle will likely go on for longer than we all expect there is nothing to do for now other than not lose sight of the past. Oh yah, and have plan
Those who cannot remember the past are condemned to repeat it - George Santayana (1905)
Curious Minds Want to Know
There should be no question as to why people need to invest. The cost of everything you need continues to rise and your savings need to keep pace. In the chart of US Price and wage changes below, I wonder if the #2 biggest riser, college tuition, includes the cost of paying bribes, proctor assistance, photoshop training and crew lessons? If not, can you imagine how much further ahead of hospital services it will be in the next update?
Curious minds want to know.

From the Ashes?
I haven’t written about the Millennial savior, bitcoin, in well, it seems like forever. Not because I don’t like it but rather its was in a horrendous long-term downtrend, losing more than 90% of its value in 15 short months. What’s there to talk about? But, of late its price has taken a much more constructive look as it has been trading sideways (instead of falling further) and looks as it may have found a short-term bottom while trying to clear out the remaining sellers. This, of course, is an ideal setup for a bullish trading opportunity. While it may turn out to be a long-term investment (not my belief), until it proves itself it must be viewed only as a trade.
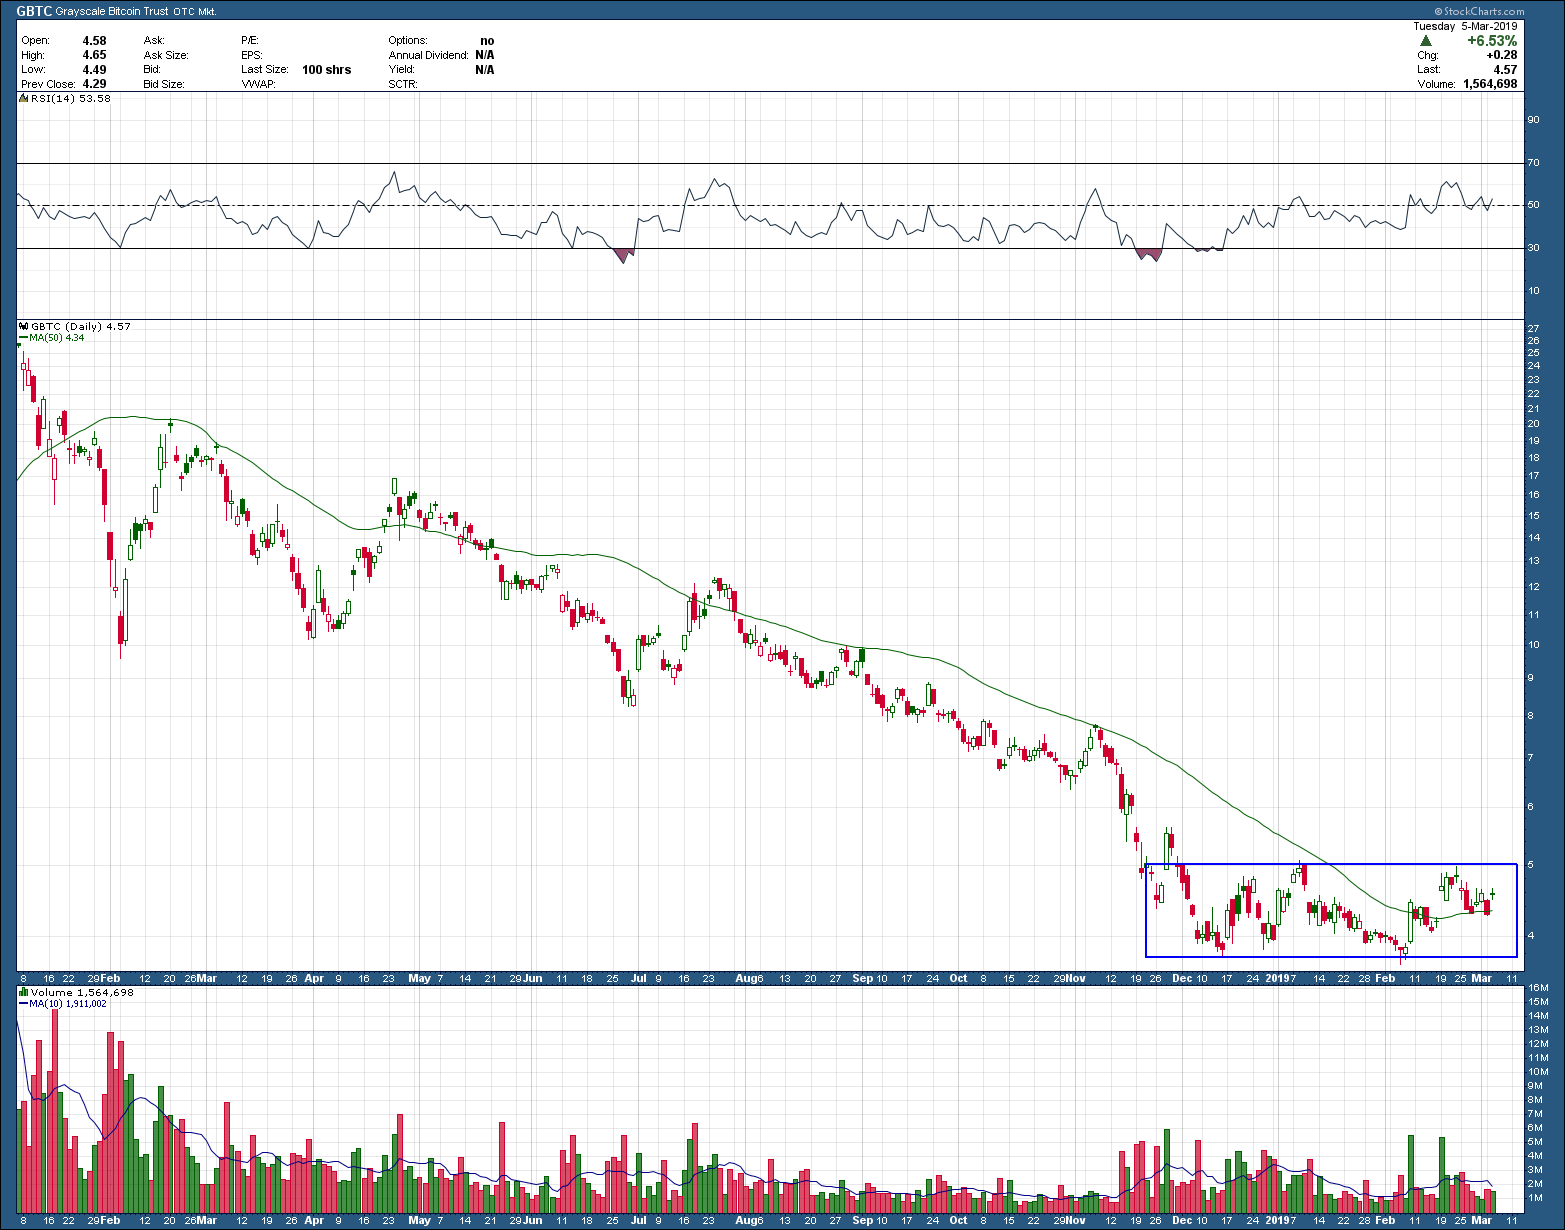
As you can see, price has been contained within the rectangular box, is now above a rising 50-day moving average while volume (bottom pane) has been shifting from large red candles (selling) to green (buyers). In spite of its potential short-term holding period, the first upside target is ~25% above the upper boundary of the rectangle. Two ways to trade this setup using this pink sheet bitcoin proxy, GBTC, is to buy the breakout of the rectangle, with a stop placed 3% below the breakout level after purchase. The second, which has a much higher upside target (>50%) but has less chance of getting filled, is to place a limit order down at the bottom of the rectangle. If the order gets filled, your stop would be placed 3% below the bottom of the rectangle. In either case, the risk is well contained (likely less than 5% depending upon the price of GBTC gets filled at) and provides either a 25% or 50% potential pattern target reward. A minimum 5:1 or best 10:1 reward to risk is a setup any investor/trader would love to have as they don’t come along that often.