Miscellaneous

Electoral Overload

336 stocks are down more than 20% for the past month. Only 36 are up more than 20%

independent bay area cfps advisor - sp500 11-7-16

The SP500 made it nine sessions in a row of declines on Friday.  The first time in 36 years. But it is only down 3% over those 9 days, unlike the previous occasions which saw a drop of -7% on average. This shows relative strength..  In the past 86 years, there have been 22 occasions of 9 down days.   Six months later SP500 was up 74% of the time with an average return of +9%.  For 12 months, a rise of +14%. The average loss was -7%. These down streaks have historically been good buying opportunities, Will it be this time?

Sentiment says we are getting close to a bounce as the boat is over-crowded on one side.

fee only independent financial planning advisor - sentiment - 11-7-16

Recent market gyrations are a byproduct of the uncertainty around the election. In two days it will be over and only then are we likely to see what hand Ms. Market is playing. Until then, it’s all noise.

Leaving the Island

An Island Top, one of the most reliable patterns, occurs when a upward trending price "gaps" above a specific price range and then is confirmed when the price "gaps" down below to the original range. That “island” that is created can be made up from one day or a cluster of days (formed by several bars rather than one) which is a much more powerful signal. The island cluster would look something like this example:

best independent investment advisor cfp retirement planner - island top example 9-12-16

With that in mind, below is the chart of the 20-year Treasury bond ETF, TLT. As you can see, TLT was in a confirmed uptrend and gapped up on June 27 and spent the next 58 trading days above the gap (encompassed within the red box). Last Friday, Sept 9, you can see price gapped below the box and through the up gap of June 27, creating an island.

best pleasanton investment advisor & retirement planning, cfp 9-12-16 TLT

Island tops have an historical success rate of 77% with an average decline from the successful formations of -21%. While nothing is guaranteed, this pattern's high probability outcome if validated with follow through in the next few days, the market’s concomitant rise in volatility and poor seasonality is a warning that bond holders are likely in for some near term pain

Solar Flair

As I evaluate solar technologies and vendors for an installation in my home, I was interested to see the shift in US electricity generation in the first half of the year. It’s hard to believe that just 5 years ago coal had a 40% share in power generation. The relentless cost declines, government subsidies and capacity increases for both wind and solar are now very much a part of coal’s current declines. Combine that with the learning rate of renewables should add further downside pressure on coal, estimated to fall to the low 20-25% with wind and solar picking up the slack for a combined 15% by 2020.

best independent pleasanton retirement advisor financial planning cfp 8-31-16- tan

The technological advances have pushed efficiency's into the low 20% making solar installations nearing a 5-6 year ROI. While solar for the home becomes more cost competitive and an increasingly better ROI, you can’t say the same for solar stocks. TAN, the solar ETF is down 90% from its inception date.

best independent bay area financial advisor cfp investment management planner 8-31-16

For now and until things change most of your eco-friendly investment dollars appear to be best utilized in your home rather than your portfolio.

Get the Door

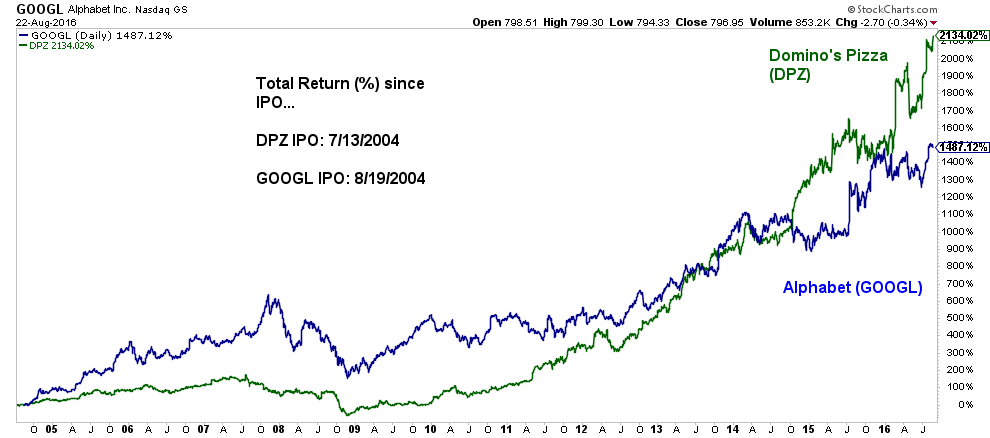
If I asked you what company had the most successful IPO since 2004 (based upon share price increase) if you are like me the first company that came to mind would be Google or maybe some other tech giant.  If so, you would be wrong like I was.

Pleasantons best bay area financial advisor, retirement planneing CFP

Who'da thunk? I guess I must be the only person in North America to have never had the pleasure of tasting #1.

Just for the Smell of It

The Hard Rock Café Hotel in Orlando pumps out artificial scents of sugar cookies and waffle cones that act as “aroma billboards” to draw people to their ice cream shop in the basement (increasing sales by 45%). The marketing company ScentAndrea attached chocolate artificially-scented strips to some vending machines in California, tripling Hershey’s sales. The Hershey’s store in Times Square uses artificial scent machines that blow the scent of chocolate into their store. Disney reportedly applies an artificial “grilled scent” to their frozen burgers to make them smell fresh, along with strategically placed scent machines in the bushes that disperse scents of cotton candy, popcorn, or caramel apples. According to the Scent Marketing Institute, when the smell of fresh baked bread was pumped into a grocery store, sales in the bakery department tripled. A grocery chain in New York (Net Cost) admittedly places scent machines that release scents of chocolate and baking bread to make customers hungry, and sales jumped.

Even subtle changes in operations can trick our noses and make a big impact on increasing food sales. For instance, Panera Bread recently moved its baking time to daytime hours so that customers smell the bread all day long and their New Haven, Connecticut location has a small “show oven” without a hood, so the smells vent into the restaurant. This is the same reason that Subway places their bread ovens up front in their restaurants, so that smell hits you when you walk in the door. Starbucks has an “aroma task force” to make sure their stores smell like coffee and not the cheese from their breakfast items

So don’t be surprised the next time you drop into our office and feel rich as we are working with the SF Federal Reserve to capture a new, “crisply minted $100 bill” scent for use in our Glade “office fresh” dispensers.