
A quick 3 minute video on where we are with respect to the US stock market.
From the Ashes?
I haven’t written about the Millennial savior, bitcoin, in well, it seems like forever. Not because I don’t like it but rather its was in a horrendous long-term downtrend, losing more than 90% of its value in 15 short months. What’s there to talk about? But, of late its price has taken a much more constructive look as it has been trading sideways (instead of falling further) and looks as it may have found a short-term bottom while trying to clear out the remaining sellers. This, of course, is an ideal setup for a bullish trading opportunity. While it may turn out to be a long-term investment (not my belief), until it proves itself it must be viewed only as a trade.
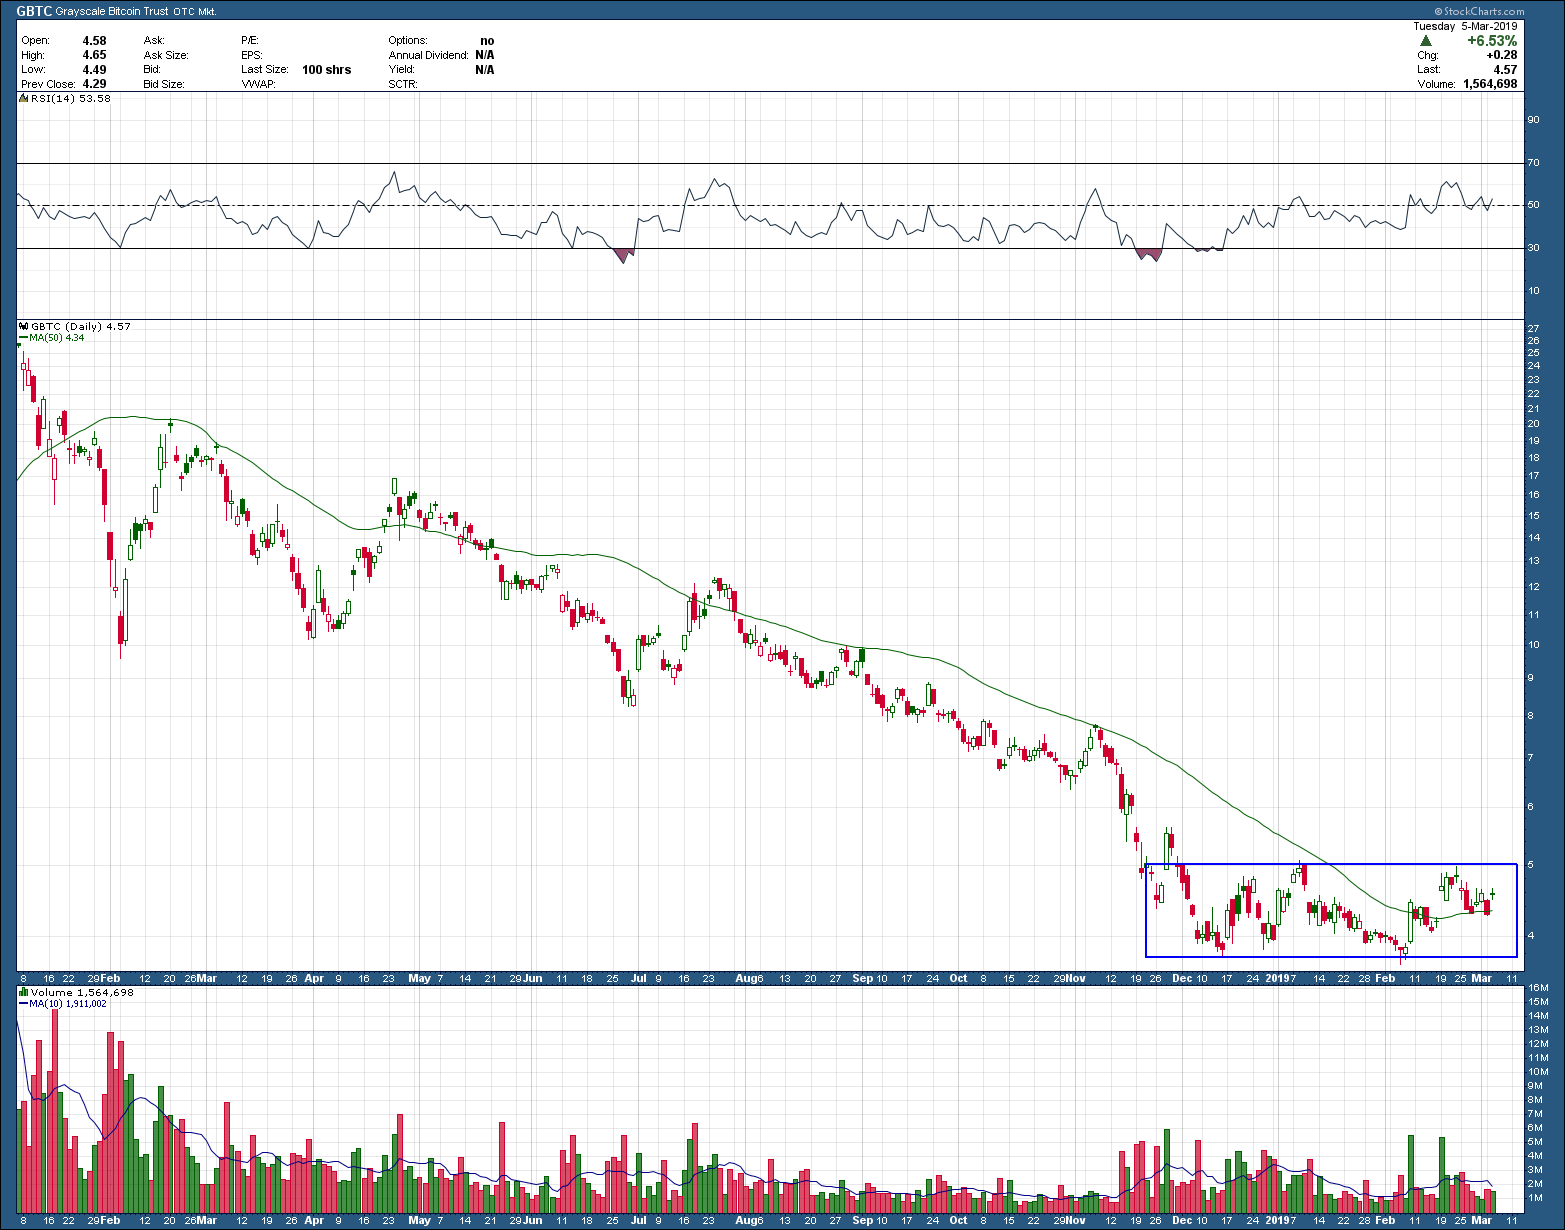
As you can see, price has been contained within the rectangular box, is now above a rising 50-day moving average while volume (bottom pane) has been shifting from large red candles (selling) to green (buyers). In spite of its potential short-term holding period, the first upside target is ~25% above the upper boundary of the rectangle. Two ways to trade this setup using this pink sheet bitcoin proxy, GBTC, is to buy the breakout of the rectangle, with a stop placed 3% below the breakout level after purchase. The second, which has a much higher upside target (>50%) but has less chance of getting filled, is to place a limit order down at the bottom of the rectangle. If the order gets filled, your stop would be placed 3% below the bottom of the rectangle. In either case, the risk is well contained (likely less than 5% depending upon the price of GBTC gets filled at) and provides either a 25% or 50% potential pattern target reward. A minimum 5:1 or best 10:1 reward to risk is a setup any investor/trader would love to have as they don’t come along that often.
Watching the Transports
A bearish engulfing candlestick pattern is a reversal pattern, occurring at the top of an uptrend. The pattern consists of two candlesticks: 1) a smaller bullish candle (Day 1) followed by a 2) larger bearish candle (Day 2). The bullish candle real body of Day 1 is contained within the real body of the bearish candle of Day 2. On day 2, the market gaps up (typically interpreted as a bullish sign) however, the bulls run out of gas and do not push price very far before the bears take over reversing price down, not only filling in the gap from the morning’s open but also below the previous day’s open. A completed pattern warns of a high probability (at least for the short term) the uptrend is over. The larger the candle body and volume on day 2, the higher the probability of a reversal.

Taking a look at the weekly chart of the Dow Jones Transportation stocks you can see last week closed with that same bearish engulfing candle. Unfortunately for the bears, while last week’s candle did engulf the prior week, it was not overly large. In addition, the weekly selling volume was just slightly above average, nothing out of the norm. If you look to the immediate left at the most recent prior peak in November of last year, it too formed a bearish engulfing pattern where the gulfing candle was not only huge but was confirmed with excessive selling volume. Notice what happened immediately following. This is why you need to take notice when these patterns appear

I have been saying for a couple of weeks the market looks tired but was not yet telling us we had reached the end of this reversion to the mean bounce from last Christmas eve. With last week’s close though, the transports have thrown out the yellow caution flag warning long-term investors to likely expect further selling pressure and short-term traders to cash in their chips or at least tighten stops.
Your Turn
Those long-term followers know I use ratio charts as a part of my process, mostly to help determine where best to allocate investment capital. As with investment prices, trends persist when it comes to outperformance (ratios). The chart below I call “Risk On” is a ratio of the US SP500 stock index performance to US 30-year treasury bonds and its message helps define current risk levels. If the ratio is rising, risk is low and you have achieved (and will likely continue due to trend persistence) the best return by investing in US stocks only. If the ratio is falling, risk is elevated and bonds are out-performing.

With a quick glance, what should be immediately noticeable is the ratio broke below its rising uptrend support line in November of last year. This occurred at the same time when RSI momentum (upper pane) diverged (both short term and longer term) with the ratio warning of an increase in risk and possible trend change. From that point the ratio was crushed with the strong year-end selloff in stocks.
With stocks rebounding strongly from their massively oversold condition the ratio has, as you would expect, mirrored its move higher. Uninspiringly, the ratio closed out yesterday still below its falling 200-day moving average and has yet to make its first higher low. Looking left we see that the ratio is about the same place it was 12 months ago telling us that stocks and bonds have had a comparative return. Now what?
Closing out this post right here intentionally not providing a summarization or point to the post, I am wondering how you would interpret the charts message? Pile in to stocks gunz a blazin’? Stay on the sidelines in the safety of bonds and let the dust settle? or something in between? I’d love to hear your thoughts and opinions.
GOLD – The Possibilities
Viewing the barbarous relic from a very long-term can help filter out the day-to-day noise. As you can see in the 20-year chart below, Gold’s price (the middle pane) was in a strong uptrend that lasted nearly 13 years, ending in 2011. In the bottom pane, you can see in the ratio of performance between gold and the US stock market, gold massively outperformed, exceeding the SP500 by more than 600% at its peak during that uptrend period.

As you would expect, 2011 not only marked the end of Gold’s uptrend but also its out-performance as stocks have gone on to outperform gold by almost 500%. Investor should be thinking to themselves why be in stocks when gold is outperforming? and vice versa. Diversification?
Gold’s price bottomed at the end of 2015 and has risen slightly since then but has gone nowhere for almost 6 years. Do I need to even say it? It’s been “dead money”. What has caught my attention though, is the saucer bottom that gold’s price has taken on that has formed over that “dead money” period. I shouldn’t have to mention the potential inverse head and shoulders bottom reversal pattern that is in development and screaming out “NOTICE ME”. Please note the word potential as it still has a lot of work to do to get to where it is something more than just “in development”. I have been watching this build out over the course of years and it’s been an agonizing tease as it has failed to breakout above the horizontal resistance zone at least 8 times. As we approach that zone once again, will this time be any different? Or will we get our investment hands slapped once again?
The key for me to over allocate investment capital will be to see at least two things 1) Golds price break out above the pattern’s neckline (blue horizontal resistance area) sooner rather than later before the pattern becomes unsymmetrical and invalid; and 2) a higher high followed by a higher low made on the bottom performance ratio chart. Until then any position in gold is nothing more than a trading vehicle.
At its current pace, investors will be lucky to see both of these items happen in the near term as such it stays on our radar and is stalked. Besides the potential for a future profitable investment opportunity, the other major take-away’s (something I continue to reinforce every chance I can) are 1) investment themes trend for years as such being able to recognize turning points is key to long term out performance 2) just because an investment opportunity can make you money, it may not be worth your investment capital if it doesn’t outperform your other ideas/holdings.