It's What You Do

I saw this long term SP500 chart from 360virtual and thought it does a good job putting the current correction into perspective. Interestingly yesterday we hit the average annual yearly pullback of 11.5% almost exactly. It should have come as no surprise as have been talking about its eventuality for (too) months. So now what?

Bay area Certified Financial Planner Investor

There are no guarantees on what the markets will do next but TA teaches us what is possible and I wanted to lay out what I believe is the likeliest outcome for the short-intermediate term based upon the tale of the charts.

Tuesday’s action was a very compelling tell as the markets could not hold on to their early morning gains showing that whatever was bothering the markets still is. Until this gets resolved we are going to struggle to move materially higher. A “V”-bottom like we had for the entirety of 2014 appears to be unlikely right now. As such with a weak tape and overhead resistance I see lower prices ahead.

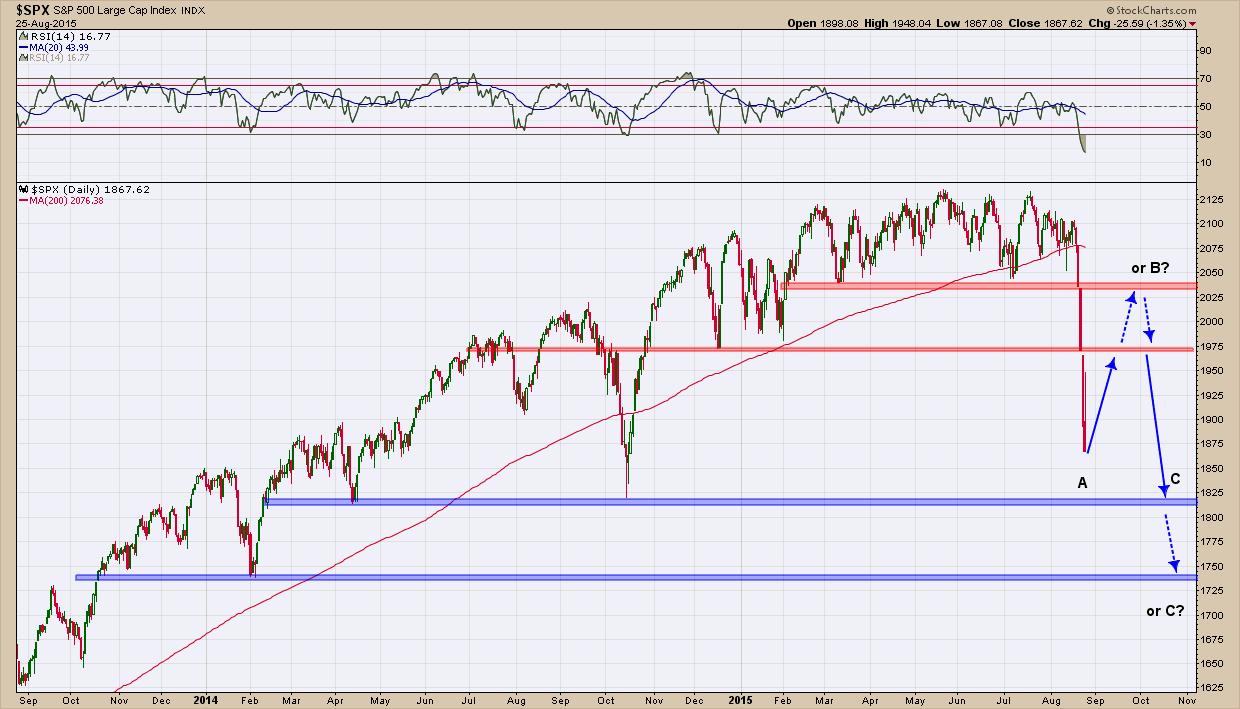
Below is the SP500 daily chart illustrated with all the important horizontal (blue) support and resistance (red) lines. It’s important to remember those lines represent buyers (at support) and sellers (at resistance) if/when price approaches. As we know corrections are typically 3 wave (A-B-C) structures. The first wave down is A, a reflexive bounce higher is B and the final wave down is C. My view is yesterday completed wave A and are now in wave B, the oversold bounce higher. Upon completion of B we will need one more test lower to complete C.  You can see I have illustrated the chart with an ABC pattern and where likely “B” and “C” terminations will end (if this truly is an ABC correction). I expect “B” to end at or near the December 2014 lows ($1972) as this represent a previous large supply of potential sellers. A retest of the lows could find “C” zero in on the Oct. 2014 lows, $1820, an important past level of buyers.  I have also placed alternative “B” and “C” termination points (the next level of support (buyers) and resistance (sellers) levels) should the market wants to overshoot to either side.

Bay area financial advisor

As we know the markets will do what they are going to do and no one, including me knows what comes next. Trying to predict the future is a fool’s game. So one may ask why put these types of posts out for ridicule since it likely I will be wrong. The fact is what I have posted is one likely outcome and situation planning is what we do every day in our Investment Committee meetings. It’s our job to analyze the possibilities and work through the necessary action plans should they play out.  Like Geico says, “It’s what you do.”  

FeElInG BaD

The US stock market just can’t seem to catch any love.  Fear indexes are ramping higher and investors are looking for excuses to exit the market. Greece, rising interest rates, valuations, the FED, China stock market crash, oil prices falling off a cliff, the wall of worry is getting higher each day. How is it with all of this as a negative market backdrop stocks can be within 2% of all-time highs? All you have to do is look under the hood and while the indexes are still holding up, the average stock is struggling.

Some stats may help explain (data provided by Ryan Detrick, CMT) -

·        More than 120 of the 500 SP500 stocks are down more than 20% from 52 week high

·        The average SP500 stock is down more than 14.5% from 52 week high

·        Just slightly less than ½ of the SP500 stocks have prices below their important long term 200 day moving average

·        Just under ½ of the SP500, 232 stocks, are in a death cross (50dma has crossed under 200dma)

o   The best sector is health care where less than 13% fit

o   At 80%+, energy and utilities are bringing up the rear.

·        The Dow has been in a 6.4% trading range (from high to low) since the beginning of the year. This is the lowest year on record.

·        The Dow was down the first seven of eight days in August, worst start to a month since down seven of eight in July ‘12.

As you can see while the overall index is doing ok, about half the stocks are either struggling or hurting.  Maybe this is why it feels so bad. As Yoda would say “A precarious time in the markets, we have”.  Until this gets resolved, sitting on your hands and doing nothing will likely be the most profitable strategy.

One Grande Non-Fat Cappuccino, Please!

Below is a 5 year weekly chart of Coffee.  After peaking in October last year the negative momentum divergence raised a warning flag a correction was likely.  From that point coffee fell almost 45% over the next 10 months.  During the last 6 months you can see it formed a bullish falling wedge pattern while creating positive momentum divergence. Last week coffee broke strongly out of the wedge higher confirming the move with very large volume (in bottom pane). While the last bottom in November of 2013 was V-shaped, I would not chase this here as I do not expect that to happen again. I would instead look for a higher low to be formed or a retest of that wedge breakout level. If investing in coffee beans is not for you, you had better go get your coffee "jones" filled at your local Starbucks before they raise prices again as the projected target for this breakout is 30%.

Bay area investment advisor financial planner cfp


The Positive Feedback Loop is Broken

One of the most read bloggers and columnist writing about Wall St is Joshua M Brown – The Reformed Broker. His latest column was superb so I thought I would repost it for those who have not had a chance to read it ….

 ================================

The rat runs left and reaches the cheese. He is rewarded by the maze. Guess which direction he runs the next time through. And the next. And the next.

Run left, get cheese. Run left, get cheese. 

Another rat is dropped in and proceeds to run right. No cheese. He gets an electric shock instead. Guess which direction he never runs in again.

Don’t go right, don’t go right, don’t go right …

In an uptrending market, investors are conditioned to hold onto their investments and buy more because it continues to reward them. This is true for real estate, commodities, venture capitalism and, of course, the public markets. I buy stocks, they go up, it feels good, I buy more stocks, they go up, it feels good, I buy even more stocks, they go up, it feels good…

The longer this goes on for, the more ingrained the conditioning. Tentative dip-buying gives way to confident leaps into the breach. This is why the dips become short and shallow while the recoveries become v-shaped. No time to lose!

But then, slowly, the instant gratification begins to subside. It is imperceptible at first. They’ll bounce back, they always do! But they stop bouncing back. The positive feedback loop breaks down. I buy stocks, they don’t go up, I buy more stocks, they sink lower…

This is when the first wave of doubt sets in and the conditioning wears off. There are less buyers coming in because the reward is no longer instantaneous. Where’s the cheese? 

Peaks are formed in a given investment market as the realization slowly dawns that the good feelings are not automatic anymore. They say that bottoms are an event (no one left to sell!) and tops are process. They’re right. Which makes the term “peak” itself a misnomer. Markets top in a hill formation – a gradual course of persistently lower highs alter the slope of the market and round it downward as investor enthusiasm fades.

One of the least understood things about the stock market crashes of 1987 and 1929 is that they did not begin from all-time record highs. They each happened several weeks after record highs had been established. In ’29 the Dow Jones topped out during the week before Labor Day. The months of September and October went by in a sort of suspended animation – investors bought more stocks but the automatic gains – the instant karma – of the prior few years failed to materialize. Where’s the cheese?

The rest is history.

In the case of 1987, the Dow Jones hit its high in late July and then for weeks and weeks investors sat there wondering where the reward was for their latest purchases. There wouldn’t be a reward. It was an electric shock instead, occurring ten weeks or so after the positive feedback loop ceased to hold up its end of the bargain. I buy stocks, they go up. I buy stocks they go up. I buy stocks they…wait a minute, what gives? This thing isn’t working right anymore. 

I use the examples of ’87 and ’29 not because I believe they are a good analog to now, but because they are extreme examples and highly illustrative of the breakdown in conditioning. The automatic, predictable gains stop showing up and confusion sets in. And then frustration. Finally, fear.

Which brings us to the present. The S&P 500 sits just a few percentage points from its all-time record high. And although we’re elevated, it is important to note that the major averages have made no upward progress since Thanksgiving 2014. This after years of compound annual returns of around 20%. We haven’t fallen, but with every passing week, more and more investors are asking themselves where’s the cheese?

Beneath the surface, there is a very different picture forming. The average S&P 500 stock is down 15% from its 52-week high. The positive feedback loop has been broken across vast swathes of the US stock market. Energy, Materials, Utilities, Technology, IPOs, REITs, Small Caps – one by one, our hearts are broken. The feedback is all negative. I buy stocks, they go down. I buy more stocks, they go even lower. Shock, shock, shock. 

What is a rat to do? Can’t run left because there’s no cheese anymore. Can’t run right because it hurts. Fear sets in. Fear leads to anger, anger leads to hate, hate leads to suffering.

We’re not quite there yet. There is real fear but the anger part hasn’t manifested itself. Although the individual losses are piling up and the gains in the overall market are failing to offset them, it is far from resolved.

The positive feedback loop can be restored if and when the plunge in the advance-decline line, highs-minus-lows index and the drastic dispersion between S&P 500 sectors reverses course. But there are no signs that this is yet happening. And the longer we go without a positive feedback loop as backdrop, the more susceptible we are to a downtrend. Which introduces a feedback loop all its own when it arrives. I buy stocks, I get shocked. I buy stocks, I get shocked. I stop buying stocks, I don’t get shocked…

The maze is closing in on us.

.