Funnymentals

Bull Market 
noun \ˈbu̇l ˈmär-kət\ 
Random market movements causing investors to mistake themselves as financial geniuses.

In spite of my continual poking fun at anyone putting too much confidence into fundamental only analysis, I do fully admit they should be a part of an investment process.  My problem with them is that they really only become obvious when looking in the rear-view mirror. They are horrible for making decisions on timing because once the information is known, the market has already reacted and it’s too late. In spite of that, I do find them useful and include them in my investment process as one element among many. They are of similar value that longer-term charts are. Directions and trends are more easily discernible and so they help to make short term decisions better but only when used with a weight-of-the-evidence approach. 

From a fundamental standpoint we know that, in theory, stock prices are directly correlated to corporate earnings growth. Stock prices move higher along with earnings and vice versa, Below is a chart of a 6 quarter look-back and 4 quarter look-ahead of the SP500 indexes earnings growth.

bay areas only fiduciary certifiedd financial planner and investment management wealth advisor.png

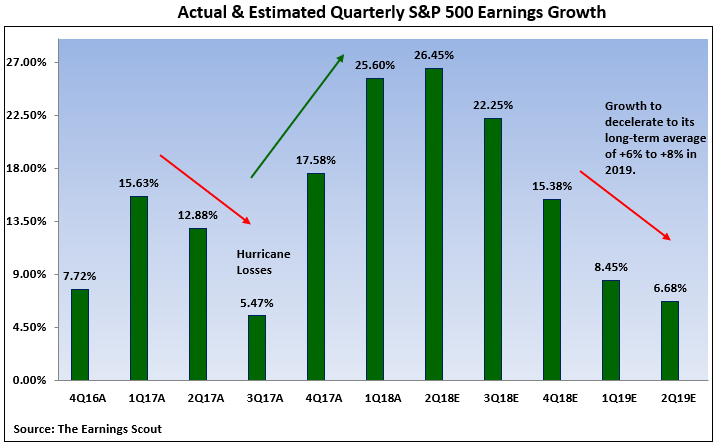
For the sake of argument if we take the estimated data at face value (don’t get me started on estimations and the ability to predict the future), the chart is telling us we will see a peak in earnings this quarter (Trump tax and policy changes) followed by a significant rollback to the long-term average. While I do believe the future growth numbers provided will be wrong, I am certain earnings will mean revert lower. Bottom line is the chart is telling an accurate tale. The when, how fast and how much will only be known in the future though. What equity investors need to determine is what impact will earnings mean reversion have on stock prices in the future knowing their strong correlation?

Seasonality 2x

It’s not the first time I have mentioned September being one of the year’s weakest months for stock returns. It should come as no surprise then that Septembers of the Presidential cycle are the weakest. What is interesting, is September in the second year has historically been the weakest month in the 4-year cycle.

San ramon napfa fiduciary certified financial planning retirement planner 9-10-18.jpg

It is theorized

  • In years one and two of a presidential term, the President exits campaign mode and works hard to fulfill campaign promises before the next election begins. It is theorized that because of these circumstances surrounding the President's work, the first year after their election is the weakest of the presidential term, with the second year being not much better.

  • This trend of initial economic weakness was thought to be true because campaign promises in the first half of the presidency are not typically aimed at strengthening the economy. Instead, political interests, such as tax law changes and social welfare issues tend to be highest priority.

  • In years three and four of a Presidential term, it is thought that the President goes back into campaign mode and works hard to strengthen the economy in an effort to earn votes with economic stimulus, such as tax cuts and job creation. As such, the third year had often been the strongest of the four-year term and the fourth year, the second-strongest year of the term.

Seems like Trump may throw a monkey wrench in this theory as he seems to have gotten it backwards.  I have been on both sides of seasonality patterns and have found that other than the rare fat tail, a 1.43% average loss is well within normal acceptable market monthly wiggle. This is especially true when you look at the historical patterns that follow September’s weakness… A big rally. Market draw-downs are both normal and healthy so if September turns out to be one, it’s time to put on our big-boy pants and suck it up --- we’re in an uptrend.

Is an Intermediate Term Internet Top In Place?

By now it should be easier to recognize some of the more basic price patterns that investments can develop. Because the head and shoulders top reversal is frequently brought up most by those who are least qualified to talk about them (the media), making them more recognizable, I thought I would bring to light one that just came up on my radar screen.

As you can see in the Dow Jones Internet Index below, it has formed a symmetrical head and shoulders pattern with a well formed horizontal neckline. In the favor of the bulls we can see the head did not make a divergent high but the volume patterns are what bears would prefer to see. As is almost always the case, there is a case for both bulls and bears to make. On a bigger picture view we should be leaning bullish as we know from experience that most of these patterns fail. Why? Because stocks are in uptrends most of the time and these patterns are uptrend reversals. As such, from a probability standpoint it makes sense they do fail most of the time. Of course, there are always short term corrections and pullbacks giving any topping patterns an opportunity to play out. It’s important to mention since we are looking at a daily chart, I am not speaking of a “final” top, but rather an “intermediate” top where price eventually moves on to new highs.

san ramon fee only investment advisor bay areas best napfa financial planning CFP.png

With all this in mind this post is not intended to cause alarm or fear or a signal to sell but rather something to learn from. I intend to come back later and post a follow up after the final outcome of this pattern has played out. The two possibilities are 1) a completion move down to T1 or below; or 2) a failure confirmed by a move back above early August’s right shoulder high (before it has completed a move to T1).

On a side note, you will find head and shoulders bottom reversal patterns (inverse head and shoulders) have a much higher probability of meeting their target. Why? For the same reason why topping patterns fail most the time. Because stocks are moving higher over the long term and you are investing with the trend.

August 2018 Charts on the Move Video

August was a barn-burner for stocks, specifically US stocks. The Nasdaq popped almost 6% and the rest of US stocks moved higher while most of the rest of the world equities fell.  Its a great time to be an investor in the current US market strength. As the pro's and big money come back from summer vacation will September follow August's lead and continue higher or will it offer something more challenging?  While we wait for this question to unfold, have a look at this months Charts on the Move video at the link below.....

https://youtu.be/6gf-MD3llM4


When Failure is Good

The are few things as short term bullish than a failed breakdown at a level of major support. The breakdown has short sellers jumping in to take advantage of a continuation of downside action. A reversal (breakdown failure) and move back above support/resistance creates upside fuel as the short sellers are forced to cover, pushing the stock higher. Depending upon the amount of shares shorted, the ongoing cover could move the stock much higher, as momentum players will eventually add more fuel as they jump on board the train higher. The thing to remember and watch is that dynamics of movement around support and resistance can lead to big moves ... in both directions

GE, a company I have lost any interest investing in, after falling more than 60% in 2 years may have found a (temporary) bottom, setting up for a reversion to the mean trade.  As you can see in the chart below, GE’s price tested the $12.75 level at least 5 times before it finally failed mid-August and began another push lower.   

As can be the case with breakdowns, price stays below support for a couple of days and reverses. GE declined 3 days, printed a hammer reversal candle and has subsequently moved higher. Yesterday it closed right on the critical support/resistance zone. A move and hold higher points to potentially much higher prices. The first target being T1 and ultimately the possibility of retesting prior 2017 highs which would provide an almost double (100% return).

san ramon CFP investment advisor and fiduciary wealth manager - GE 8-29-18.png

Before we get lost in our dreams of a first-class trip around the world paid for with the windfall profits from a GE failed breakdown, it’s always important to frame the risks. That $12.75 area is key. A move and hold above (preferably on increased volume) is a signal to be long while a revisit and hold below, tells us to move on and put the first-class trip on hold.