Is a Pending Dollar Boom Ahead?

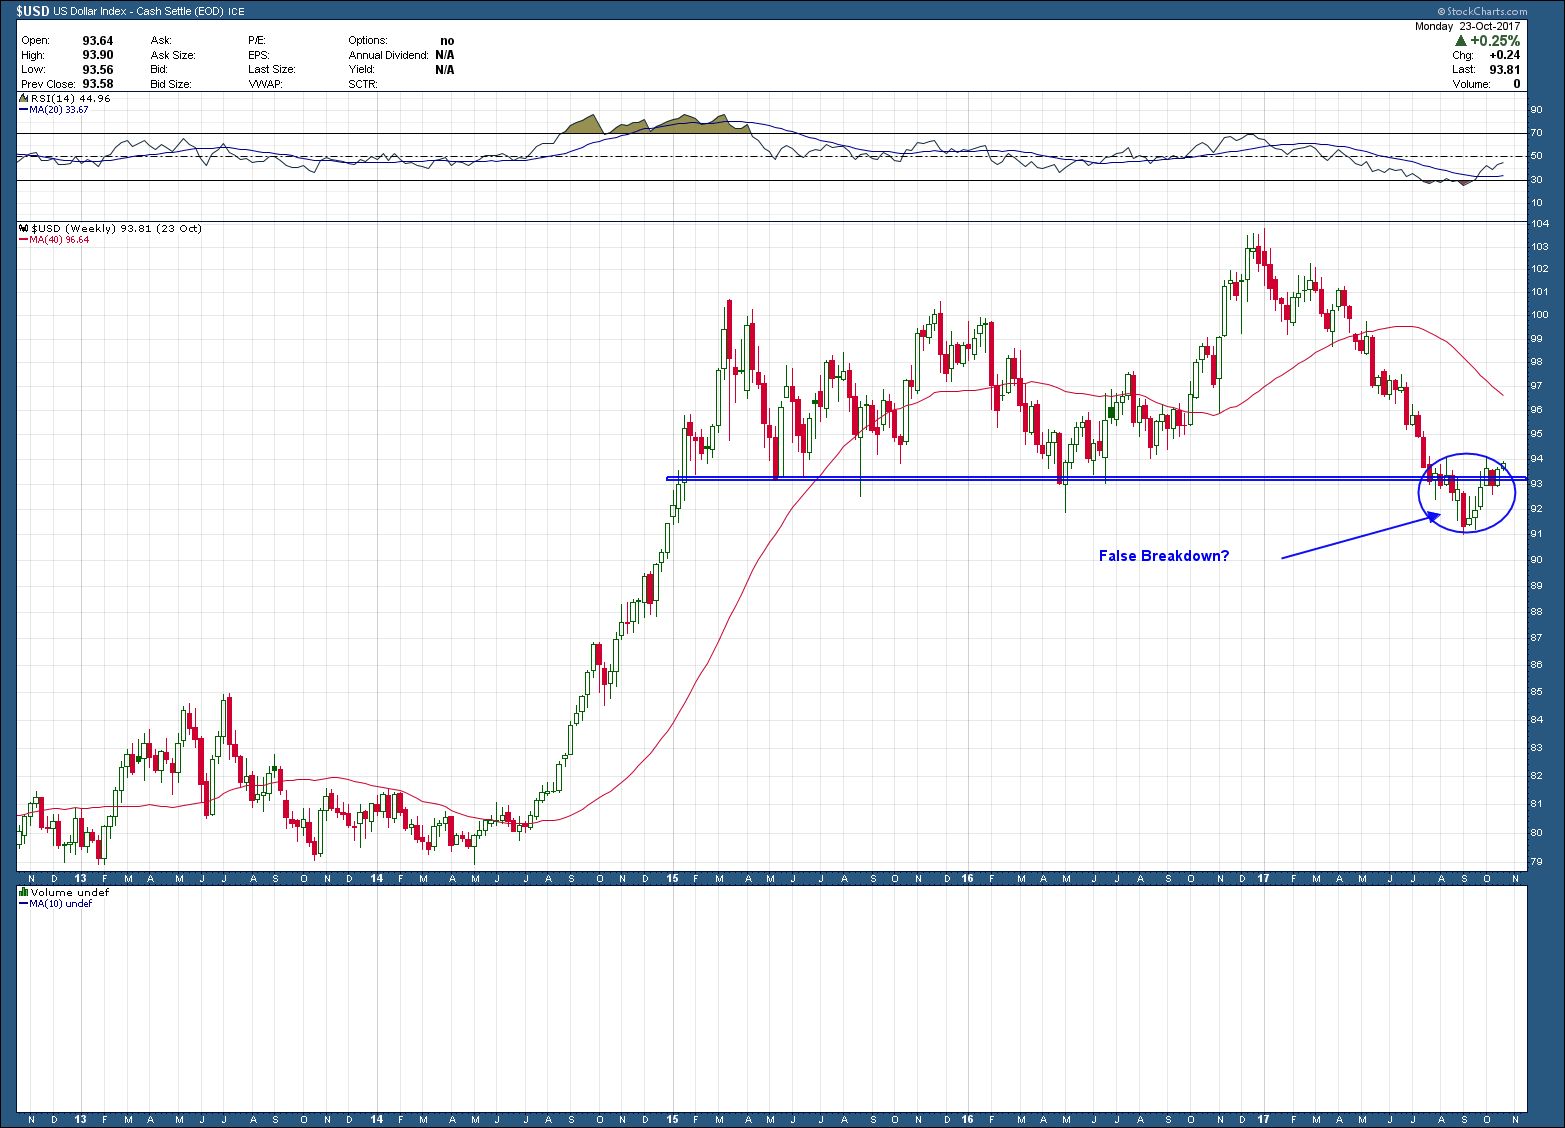
The US Dollar has been beaten up since peaking in December of last year, as it has lost more than 12% since then.  I have been a strong dollar bull advocate since its breakout in 2014 but the recent consolidation with a breakdown below horizontal support at $92, forced me to throw in the towel. From a technical standpoint you can see in the weekly chart below how one could draw the conclusion $92 was the last bastion of support before a complete breakdown was imminent. Well, as it turns out that is not completely correct. As I mentioned in my video, when prices breakout (up or down) from major areas of support or resistance, one needs to be aware of the possibility it turns out to be a fake out. A false break. False breaks usually bring powerful rallies in the opposite direction.

Bay area fee only wealth advisor and retirement planning CDP -10-25-17 - USD weekly.png

 Using longer term weekly charts help identify direction and POSSIBLE reversals but it is imperative to use shorter term views to zero in on for early confirmation and better entry/exist points. As you can see in the daily chart below, the dollar has formed (but not yet confirmed) an almost perfect symmetrical inverse head and shoulders reversal pattern while printing a divergent RSI momentum low. The pattern, if confirmed and plays out, points to an upside target at T1.

Bay area fee only wealth advisor and retirement planning CDP -10-25-17 - USD daily.png

The bottom line here is if the dollar begins an intermediate term rally, investors need to understand the potential negative ramifications a rising dollar has on owning investment that typically move inversely such as commodities, other currencies, precious metals and foreign investments. But because at this point the current setup is nothing more than a warning shot, it warrants keeping a very close eye on and keeping an open mind to a resolution in either direction.

Two Softs Looking Firm

“Soft” commodities include coffee, cocoa, sugar, corn, wheat, soybean, fruit and livestock. The term generally refers to commodities that are grown rather than mined. Many, due to deflationary pressures, have been in a downtrend since 2016. As the economy chugs along, risk asset prices in the stratosphere and interest rates climbing, based upon our understanding of economic cycles, it makes sense to see commodities gain strength.

A couple that look very interesting and setting up for big future gains are cocoa and sugar as you can see in the charts below. As you can see they look very similar. Both topped, sugar later than cocoa, fell almost 50% and have based for more than 5 months. In addition, both have formed positive RSI momentum divergence and are in the process of creating a higher high while attempting to break above prior resistance. Some important first steps necessary for a trend reversal to the upside.

east bay area independent investment advisor and fee only CFP financial planning expert -10-23-17 sugar.png
san ramon independent investment advisor and fee only CFP financial planning expert -10-23-17 cocoa.png

When trying to identify bottom reversals, I prefer to see a wide base, something north of 6 months. Because cocoa is working on 10 months, is nearer a breakout, and above its 200-day moving average I find it a more compelling opportunity. Sugars chart looks as if it’s not quite ready for prime-time yet, but worth keeping an eye on as they both could be setting up for a big climb higher

Bad Catsup

Because stocks don’t always go up, at some point this market will reverse course. For that to occur, you will see a majority of stocks in that market to eventually rollover and start their decline. Tops are a process and typically take a long time to form allowing attentive investors ample time to sidestep at least some of the fall. Please don’t misinterpret this post as me calling a top as that is not what is happening. Rather I am trying to illustrate for those interested as to what that stocks typically “look” like when their bull run is ending and head south.

The chart of Kraft/Heinz, KHC is forming that “look”.  With price having broken down out of a rising wedge and below its 200 day moving average it currently sits right on major support (S1).  Because the stock is currently in an uptrend, it should be given the benefit of the doubt and be viewed as a pullback buying opportunity rather than an imminent decline is near. But, all bets are off If S1 does not hold and price moves below that level. Doing so will have then created an intermediate term trend reversal by constructing lower highs and lower lows and forming that “look” I was referring to at the end of the first paragraph. A break below S1 indicates the next level of support and projects a price area around S2, approximately $65. Looking left at S2, because we see a potentially massive supply of shares if price were to eventually get there, it would likely take weeks and/or months of consolidation before it shows its hand and discloses the direction of its next move.   

San Ramon certified financial planning investement advisor - KHC- 10-18-17 .png

As important as share supply was an issue at S2, it is equally important if sellers remain in control and pushed beyond that.  The fact there is little supply from $45 to $62.5 tells me to expect a quick flush down to S3 if there is a confirmed break of S2.

If I believe the likely probability is for KHC to find support at S1 and to move higher, you might be asking why go through all the analysis and what-ifs. Investing is about dealing with probabilities not certainties as there are none. As such, being prepared with an action plan regardless of the outcome is 90% of the investment battle and the only way to minimize collateral account damage when the markets decide to prove your likely probability wrong.  

A Real Growth Stock

As economic cycles are reach their late stages, it is the energy, health care and materials sectors that typically outperform. Scanning hundreds of charts I see a number of very bullish setups especially in those areas, none more interesting than CF Industries, CF. This company is a major player in the nitrogen fertilizer market aiding farmers in growing their crops.

You can see in the shorter-term time frame daily chart below, price formed and recently broke out of an extended, deep, cup and handle pattern on large volume last Friday. With RSI momentum in the bullish zone and price above a rising 200 day moving average this is a very bullish setup.  What makes it so compelling is the depth of the cup base which provides the pattern target its 30% upside target.

San Ramons leading fee only CFP financial advisor - 10-16-17 - CF daily'.png

When switching to a longer-term view, the weekly chart is just as interesting and more so as Friday’s close marked a breakout from an inverse head and shoulders reversal pattern. While the right shoulder is not as symmetrical to the left as I would prefer, the upside target is even more persuasive than the daily as it points to a 40+% gain.

San Ramons leading independent certified financial advisor and wealth manager  - 10-16-17 - CF daily'.png

With a breakout of bullish patterns on two time levels, barring any corporate hiccups and If the market continuing its run higher, I find CF an extremely compelling opportunity as it is set up to lead the market with out-sized gains.

Investment Truths

1. If you need to spend your money in a relatively short period of time it doesn’t belong in the stock market.

2. If you want to earn higher returns you’re going to have to take more risk.

3. If you want more stability you’re going to have to accept lower returns.

4. Any investment strategy with high expected returns should come with the expectation of losses.

5. The stock market goes up and down.

6. If you want to hedge against stock market risk the easiest thing to do is hold more cash.

7. Risk can change shape or form but it never really goes away.

8. There’s no such thing as a perfect portfolio, asset allocation or investment strategy.

9. No investor is right all the time.

10. No investment strategy can outperform at all times.

11. Almost any investor can outperform for a short period of time.

12. Size is the enemy of outperformance.

13. Brilliance doesn’t always translate into better investment results.

14. “I don’t know” is almost always the correct answer when someone asks you what’s going to happen in the markets.

15. Watching your friends get rich makes it difficult to stick with a sound investment plan.

16. If you invest in index funds you cannot outperform the market.

17. If you invest in active funds there’s a high probability you will underperform index funds.

18. If you are a buy and hold investor you will take part in all of the gains but you also take part in all of the losses.

19. For buy and hold to truly work you have to do both when markets are falling.

20. Proper diversification means always having to say you’re sorry about part of your portfolio.

21. Day trading is hard.

22. Outperforming the market is hard (but that doesn’t mean it’s impossible).

23. There is no signal known to man that can consistently get you out right before the market falls and get you back in right before it rises again.

24. Most backtests work better on a spreadsheet than in the real world because of competition, taxes, transaction costs and the fact that you can’t backtest your emotions.

25. Compound interest is amazing but it takes a really long time to work.

26. Investing based on what every billionaire hedge fund manager says is a great way to drive yourself insane.

27. It’s almost impossible to tell if you’re being disciplined or irrational by holding on when your investment strategy is underperforming.

28. Reasonable investment advice doesn’t really change all that much but most of the time people don’t want to hear reasonable investment advice.

29. The best investment process is the one that fits your personality enough to allow you to see it through any market environment.

30. Successful investing is more about behavior and temperament than IQ or education.

31. Stock-picking is more fun but asset allocation will have more to do with your overall performance.

32. Don’t be surprised when we have bear markets or recessions. Everything is cyclical.

33. You are not Warren Buffett.

34. The market doesn’t care how you feel about a stock or what price you paid for it.

35. The market doesn’t owe you high returns just because you need them.

36. As Yogi said :It's tough to make predictions, especially about the future.