Anatomy of a Short Sale

When it comes to investing, the terms long and short refer to whether an investment was initiated by buying first or selling first. A long trade is initiated by buying with the expectation to sell at a higher price in the future and realize a profit. A short trade is initiated by selling, before buying, with the intent to buy the stock back at a lower price and realize a profit.  Most everyone understands what being long is but based upon feedback I am getting from some blogs posts, many are not familiar with what a short sale is. So, today’s post I wanted to share a real time example of a short sale I recently placed in my personal account.

The Mechanics

In order to do a short sale, an investor has to borrow the stock or security through their broker from someone who owns it. Once borrowed, the investor sells the stock, retaining the cash proceeds. The short seller hopes that the price will fall over time, providing an opportunity to buy back the stock at a lower price than the original sale price. Any money left over after buying back the stock is profit to the short seller. It’s important to know not all investments are available to short, typically the fewer the number of shares traded on a daily basis the less chance your broker will have a pool available to borrow from.

The Benefits

Shorting, or selling short, allows savvy investors a way to profit regardless of whether the market is moving up or down. The big upside to short selling is that when investments fall they usually fall much faster than they rise so profits can rack up very quickly.

The Risks

Short selling can be profitable when you make the right call, but it carries greater risks than what ordinary stock investors experience. When you buy a stock, the most you can lose is what you pay for it. If the stock goes to zero, you’ll suffer a complete loss, but you’ll never lose more than that. By contrast, if the stock soars higher, there’s no limit to the profits you can enjoy. With a short sale, however, that dynamic is reversed. There’s a ceiling on your potential profit, but there’s no theoretical limit to the losses you can suffer (assuming you hold and never cover – clearly not a good plan).

The Example

The set up for my short entry in BKI was because it formed a requisite 5-touch bearish rising wedge while RSI momentum begun diverging with price, the warning signs of an impending decline. For wedges, a break and hold below the lower support would be an ideal entry for a short sale, which is where placed my order to borrow shares. The rising wedge’s price objective is down at T1 so if this pattern were to get there it would be my plan to cover (buy) some or all of the shares.

Risk Management (if I am wrong) – If price fails to move lower and climbs higher instead, which it has no business doing if the pattern is real, the top of the wedge (point 5) is a great place to put a stop and exit the position. This equates to a ~$1.3/share loss. If instead, price declines as planned and eventually hits the pattern target, the gain is ~$3.9/ share which provides a very compelling 3x reward to risk for this particular opportunity.

Please note, I have laid out my plan BEFORE I enter that includes the strategy to follow for both a positive or negative outcome.  I plan for it to work in my favor but if I am wrong, I don’t want to stay wrong and desire to exit with as small of a loss as possible.

bay area certified fianncial retirement planner and fee only napfa financial advisor - bki0 7-31-18.png

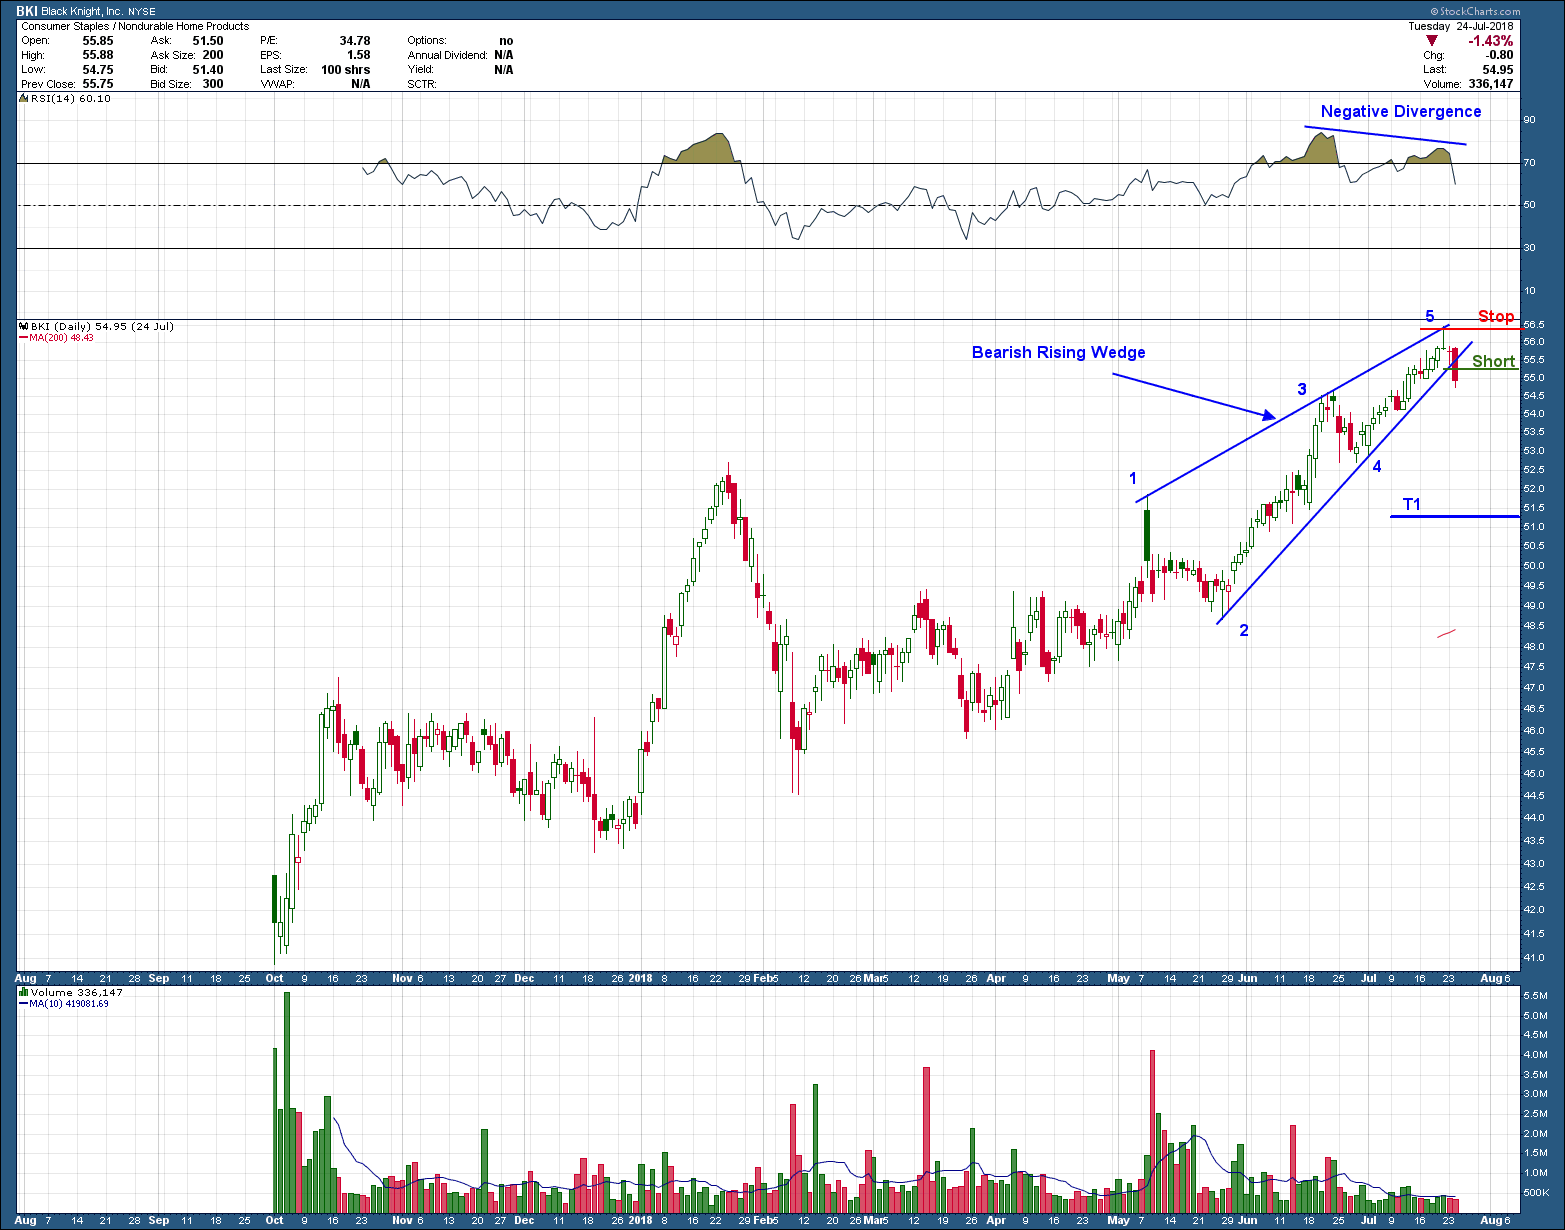
Fast forward to yesterday and you can see price hit the target and I exited the position in 5 short days. To put it in perspective, it took only 5 days to wipe out what it took the same stock to earn over the prior 40. Stairs up, elevator down and why investors always need a plan. For me, it turned out to be a short term investment, not my plan, but a 7% gain in 5 days works out to be more than a 300% annualized return, something I would take every time if given the chance.  To put it in perspective, 7% is close to the long term returns stocks have realized on an annual basis.

bay area certified fianncial retirement planner and fee only napfa financial advisor - bki 7-31-18.png

In Summary

Short selling is fighting the longer primary upward bias in stock prices so it poses a different set of risks that, if not experienced in dealing with, can create big account losses. On the flip side, that upward trajectory has not been in a straight line and those that have been skilled enough to short at the right times and the right investments have been handsomely rewarded allowing those with the knowledge a path to make money regardless of whether the market is falling or rising. With that said, I can’t emphasize enough short selling for the inexperienced is NOT worth the risks. Investing is only done to make money, not gamble and unless you have an investment strategy that has positive expectancy for short sales I would suggest sticking to only going long since you have the strong upward bias as a tailwind increasing your probabilities of success.

Two for the Bears 2

Topping patterns are set, all that is needed now is confirmation for the bears to be loose.

The first chart of WDC I meant to post 2 weeks ago before it had broken below the neckline of the head and shoulders pattern which occurred last week. If this pattern confirms and follows through, the likely target is down at T1, a 30%+ decline from last week’s close. Before I move on I want to point out if you look to the left-hand side of the chart you can see this is not the first time WDC has formed this pattern. The last time, back in 2015 the stock, broke the neckline, confirmed the pattern and exceeded its target as it fell 68% (peak to trough) before forming a bottom with positive divergence.  Will history repeat? IF so, this looks like an ideal setup for a short.

bay area best fee only independent certified financial planning investment advisor - wdc - 7-30-18.png

The next chart of OAS looks to be where WDC was a couple of weeks ago. It too, has formed a topping pattern but has yet to break below its neckline or confirm the pattern. If it does, the target is down at T1, some 15% below last weeks decline and just above the 200dma. If the market wants to move lower here in the short term, the open gap below T1 is screaming to be filled and where OAS would find major support if T1 did not hold.

san ramon's best fee only independent certified financial planning investment advisor - oas - 7-30-18.png

Overall, I am seeing a lot of topping patterns, weakness in stocks that were leaders and bullish patterns that fail. This, combined with troubling action in small caps and at a time when stocks are typically seasonally weak, I am looking to take some risk off the table if the sentiment from earnings announcements continues to disappoint.

The 3rd Times (NOT) the Charm

I always keep an eye on small cap stocks as they tend to lead the overall market both in up and down markets. As you can see in the daily chart below, IWM, the small cap ETF, each time it has attempted to cross above the 169.5 level it has failed. Yesterday’s failure had a different look than the others as it was marked by relatively large volume and a bigger price swing (size of candle) than the prior attempts.

While its normal to have prices stall and reverse more than once when approaching prior breakout levels, yesterday’s failure nothing to be alarmed about. But it is nothing to ignore either and requires a cautionary approach in case it turns out to be more than just a minor pullback. We know the markets are capable of just about anything.  On the plus side price is above a rising 200 day moving average, it has formed and within a well formed cup and handle continuation pattern while RSI momentum is still in the bullish zone and has no divergence.

san ramon fiduciary and fee only CFP - bay areas bes NAPFA investment advisor -  iwm - 7-25-18.png

So why the cautionary approach? When following price movement it’s not just about specific levels and where it’s headed but, more importantly, where you have come from. In the case of small cap stocks they have risen 12% in less than 3 months, which is really too far, too fast. They need a breather. Why do I say this? A good way to recognize this possibility is to look at how far they are away from their 200 day moving average (dma) and how they have reacted in the past to that level. The further they are from their mean (the 200 dma) the higher the chance and often the greater the size of the pullback towards that mean will eventually occur. You can see that each time price has been above the 200dma by high single or double digit percentages, IWM has had a pullback. Don’t get me wrong, this is not they only warning flag with stock prices right here and why I am currently erring on the side of caution. This is just one piece of a weight of the evidence approach. With respect to IWM, we are not too far away from finding out whether the current consolidation will be worked through by further sideways movement or a deeper pullback. If I were a betting man, I would be looking for a deeper pullback, which will lead to a nice buying opportunity allowing investors the opportunity to capitalize on the expected year-end rally

The Arc

Parabolic Arc chart patterns form when a steep rise in prices caused by irrational buying and intense speculation hits its apex. Parabolic Arc patterns, formed in strong bull markets are rare, but they are reliable. These patterns trend gradually, making higher highs and lower lows in the beginning stages, but irrational buying and speculation generates a strong rally to push prices vertically which is always followed by a steep sell-off.

A Parabolic Arc is a reversal pattern and has a very predictable outcome ,,,, a significant correction. Usually ranging from 62% to 79% of the parabolic price rise and why those lucky enough to be in one on the upside, need an escape plan when the rug eventually gets yanked out from under them.

Why they repeat – Human Psychology

Parabolic Arc patterns consist of both panic buying and panic selling scenarios. As a stock breaks out and starts to rise, investors tend to feel its rising cycle is never going to end and build confidence based on hysteria. This misjudgment provides a blind faith in investors as the stock chart takes on an exponential curve-based shape. In the state of a rising Parabolic Arc, they typically see price continuing to rise without pause and quite often with a series of upside gaps. In its last stage, Parabolic Arcs move vertically as panic buying (blow-off tops) extends in an absence of sellers quite often on some unfounded expectations/news/events. Most of this climactic buying is driven by momentum and neophyte traders who fear being left behind. Finally, reality sets in, momentum diverges with price and buyers dry up. This usually coincides with a negative event or unfavorable news. This initiates panic selling and cause prices to reverse dramatically. The initial buyers and smart money take profits quickly, followed by the more patient owners and then the buy-and holders who eventually give up and throw in the towel (just about the time the smart money is starting to accumulate shares). A great example of smart money picking the pockets of the retail investors. Wash, Rinse. Repeat

I have shown completed examples of these in past blog posts but wanted to bring one to your attention that is still rising and not yet reached its upper apex. As you can see in the chart of FTNT below, price has been in a relentless uptrend since breaking out of the (blue) consolidation box and created its second touch of the parabolic arc. Price sits at the highest point above its rising 200-day average ever at the same time it RSI momentum is waning and diverging from price.  The stage is set.

CFP fee only independent financial planning NAPFA advisor - FTNT 7-23-18.png

I don’t have a clue on when FTNT’s rise will terminate, it really doesn’t matter as all you have to do is follow price. From the appearance of the chart price and volume patterns it looks as if it might have some legs and could run a bit more. Either way, it is getting close.  Those lucky enough to still own this (congrats Nick), make sure you have an exit plan that will insure you keep the majority of your gains. I would expect a swift and dramatic decline and as such those nimble enough to short the stock will likely have a high probability profit setup on a confirmed breakdown below the arc.

Times They Are A’ Changin’

A decade ago, not one Chinese company made it in the list of the worldwide top 20 tech giants (based upon company valuations). Now, they hold 3 of the top 10 and 9 of the top 20.

fee only certified financial planner located in san ramon california CFP fiduciary wealth advisor.jpg

Is this a temporary passing like what happened with Japanese companies in the ‘80s? Or is just the beginning of a longer term shift of power eastward?