
With 3/4 of the year in the books, the US stock market is moving towards a very bullish seasonality period. If nuclear bombs and Washington tweet bombs cant bring it down are we setup for a year-end barnburner? My recap of September can be seen in the video link below.
August 2017 Charts on the Move Video
For those who were lulled to sleep with August's market action, seasonality says it time to sit up and pay attention since September is historically the weakest month of the year for stock returns. Weak or not, we are in the midst of a powerful bull market so plan accordingly.
August's video link is below.
https://www.youtube.com/watch?v=0PfC6I2wVE4&t=6s
Are Fundamentals Supportive of Current US Stock Levels?
“Signs of enhanced momentum in the global economy have recently emerged. Global GDP growth has picked up to an annualized rate of over 3¼ percent since the middle of 2016, with a rebound in industrial production, global trade and investment.” – OECD Global Economic Outlook (June 7)
With more than 90% of the companies in the SP500 having reported results for Q2 here are the results:
Earnings - Q2 the blended earnings growth rate for the S&P 500 was 10.2%. For companies that generate more than 50% of sales inside the U.S., the blended earnings growth rate is 8.5%. For companies that generate less than 50% of sales inside the U.S., the blended earnings growth rate is 14.0%.
Revenue - The blended sales growth rate for the S&P 500 2017 is 5.1%. For companies that generate more than 50% of sales inside the U.S., the blended sales growth rate is 4.7%. For companies that generate less than 50% of sales inside the U.S., the blended sales growth rate is 6.0%.

What drove the out-performance of S&P 500 companies with higher global revenue exposure? At the sector level, the Information Technology and Energy sectors were the largest contributors to earnings and revenue growth in Q2 for companies with less than 50% of sales inside the U.S.
July 2017 Charts on the Move Video
With the markets and investors apparently lulled into a bullish induced coma (not unlike what happens to Homer Simpson when he sees doughnuts), seasonality tells us to expect more of the same for August. Instead with the extreme levels of complacency, extended price levels, this would be an ideal time for investors to revisit their management plans ... justin case.
My July highlights in the video link below.
Transports – At a Crossroad
When reviewing my regular review of the US sector charts, the transportation index jumped out at me. And not in a good way, let me show you why. You can see in the chart below, a 15 month look-back, price has formed a requisite 5 point, large (blue) rising wedge pattern. These patterns are typically bearish in nature and warn of lower prices, once confirmed. You can also where I have circled the area (near touch #4 of the rising wedge) where price broke out to new, all-time highs, held for a week and then reversed course retracing back to the bottom uptrend support line (touch #5) of the rising wedge. To add to the concern is normal poor upcoming stock market seasonality combined with negative momentum divergence (momentum is making lower high at the time when price is making a higher high).
I wanted to post this since it is at a major crossroad here and will likely resolve itself in the next week or two. I find it more educational and a better learning tool to post these in real time rather and watch them develop than point them out in the rear view mirror.
The bottom line is that support is support and until it is broken, this setup is nothing more than a pullback within a longer term uptrend. Because of the importance of the transportation stocks, a breakdown tough would likely pull the rest of the market down with it. If price were to reach the pattern target it would be more than a 20% decline, something stocks have not experienced for many years (but are typically regular occurrences of bull markets).
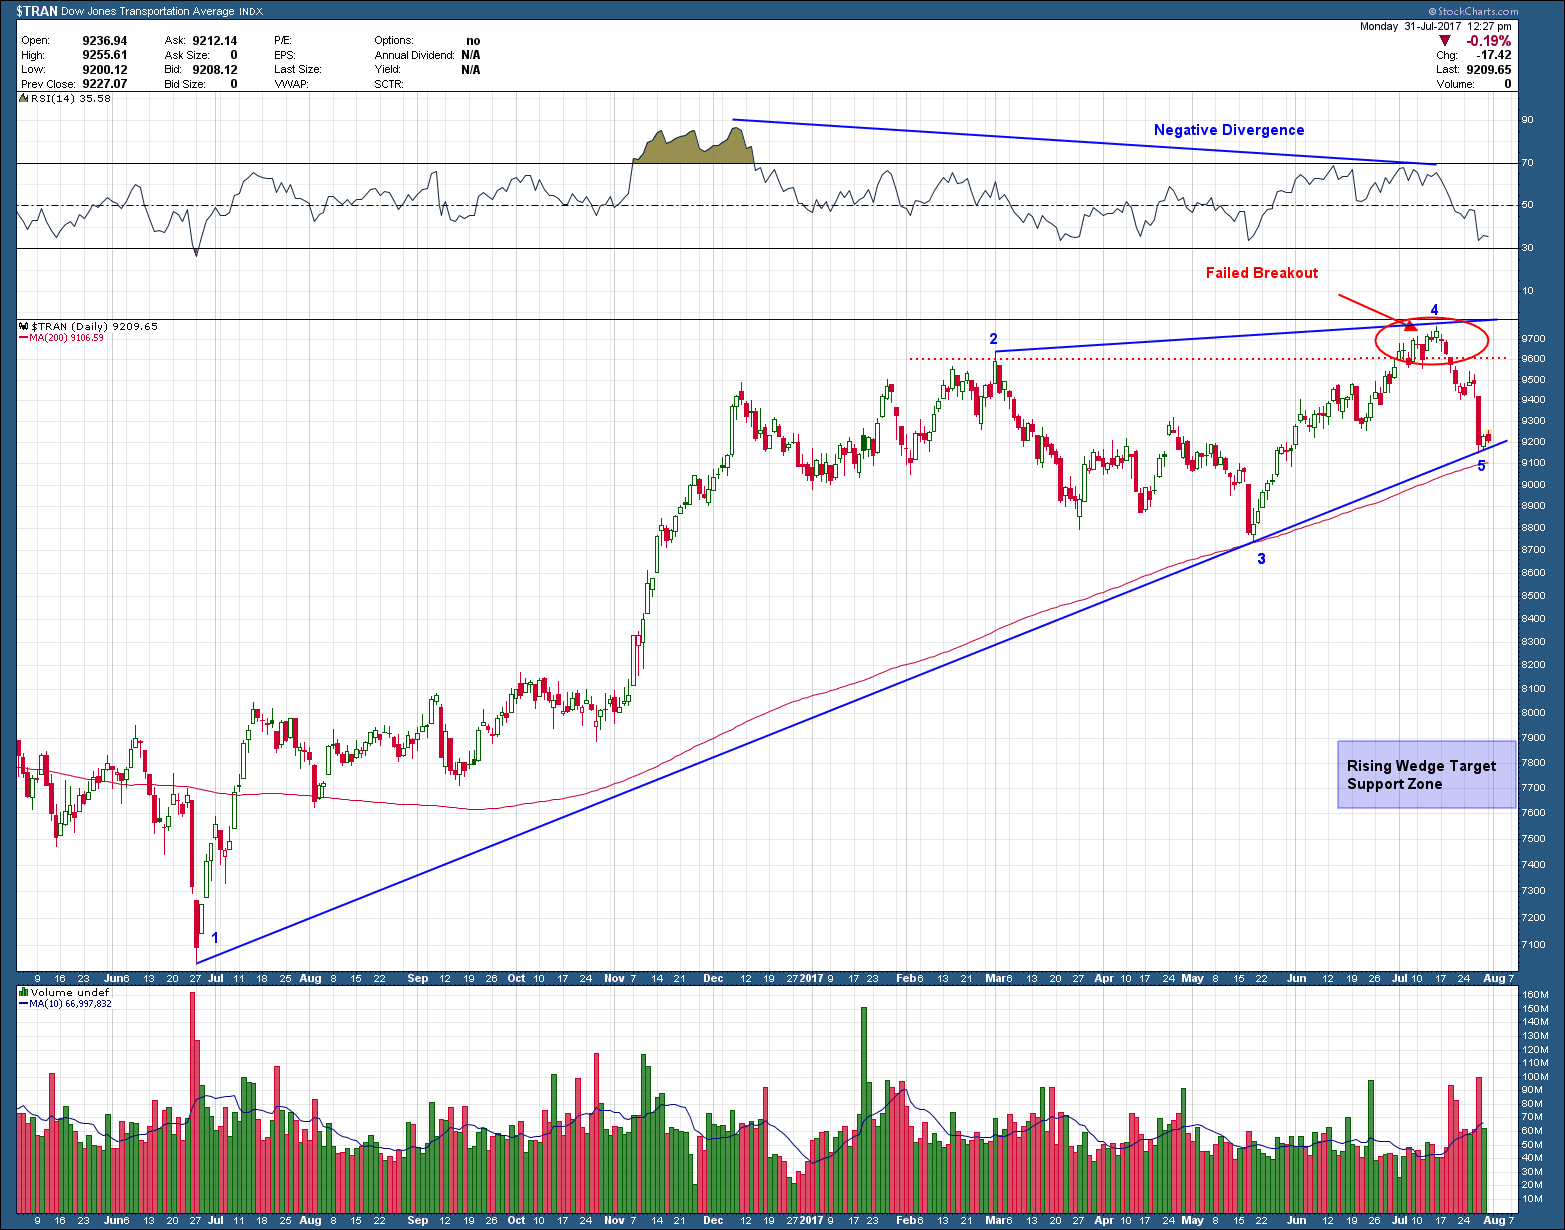
I hesitate to post bearish setups and try to keep my post more positive in nature as I have learned from feedback it freaks some investors out. I do it for those that want to look at possibilities as it then will not come as a surprise if it does occur. Forewarned is forearmed. It’s good to reiterate here before I close that I am speaking only in “possibilities” not foregone conclusions. The higher probability outcome is for price to consolidate and move higher without breaking down. That is what has happened every time since the 2009 bottom why should we expect anything different this time? Either way it’s great to remember pullbacks whether it be 5% or 20%, create wonderful buying opportunities for the next leg up in bull markets.